In this article, we have tried to collect as many HRV metrics as possible that can be found in different applications and on different devices after you get result of Heart Rate Variability measuring.
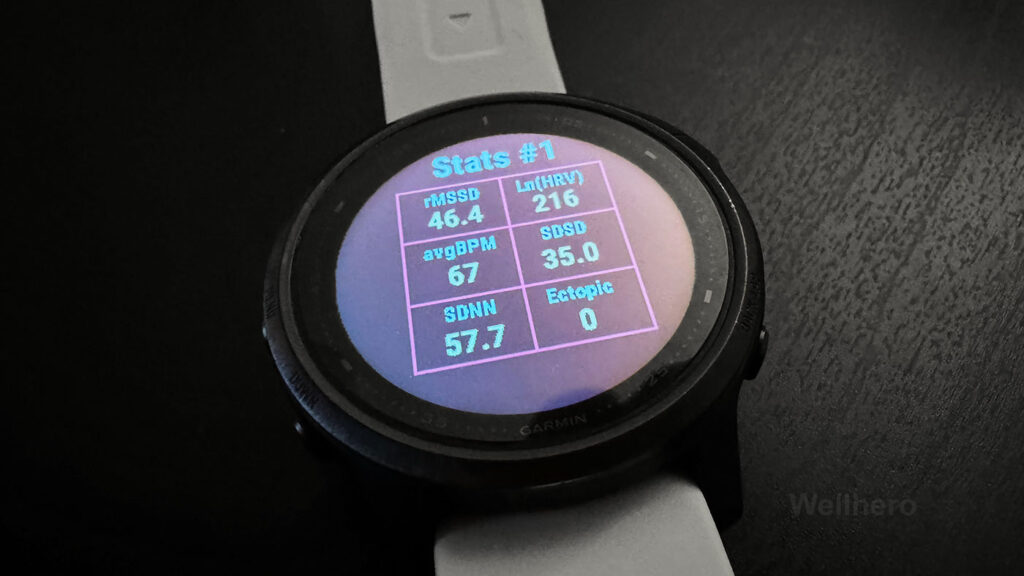
My acquaintance with HRV began precisely with this widget for Garmin watches.
I was recovering from a rather common illness that gained popularity in 2020 and started taking up running. To understand how my heart was functioning before and after workouts, I installed the widget you see in the picture above. I installed it and… didn’t understand anything.
That’s when I started studying literature and scientific articles, thinking that no one else should suffer like I did. In this article, I’ll try to gather all my experience and create a mini-guide on HRV terms and parameters.
Abbreviations and Names You Should Be Familiar With
HRV – Heart rate variability. Variety of intervals between heartbeats. If you’re not very familiar with the topic, read our HRV guide.
HR – Heart rate. Sometimes HR is referred to as pulse, which is only partially correct. Heart rate is the number of blood pulses occurring in the arteries over a certain period of time. And heart rate (HR) is the number of heart beats over the same period of time. In a healthy adult at rest, HR is equal to pulse rate.
BPM – beats per minute. The main unit of measurement for heart rate. It shows how many contractions per minute the heart makes.
Ectopic beats – extra or missed heartbeats. Often have no specific reason for occurrence, but they do happen. When calculating HRV, we remove ectopic beats from the calculation.
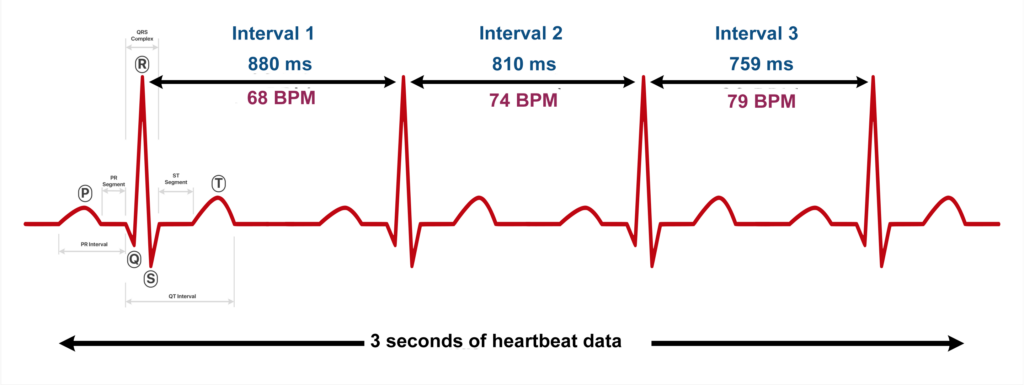
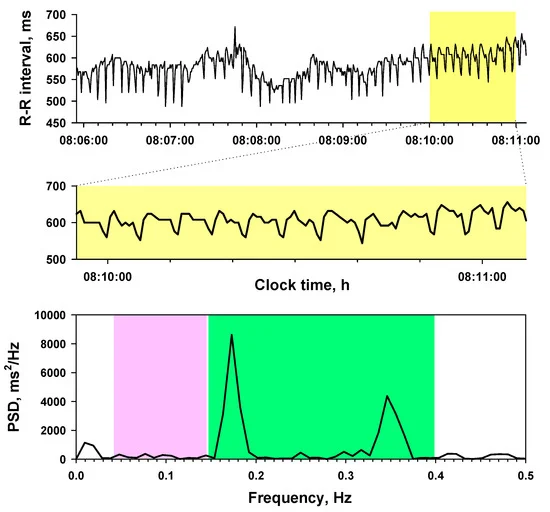
RR and NN intervals – RR intervals are the intervals between R peaks:
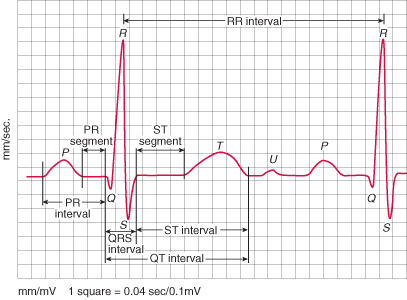
If we clear RR intervals from artifacts and take the distance only between normal R peaks, such intravals are called NN intervals. Very often RR and NN intervals are synonymous.
Heart rate variability metrics and norms
HRV time-domain metrics
Practically all metrics in this group are deviations, distributions, or percentiles of NN intervals.
RMSSD: Root mean square of successive NN interval differences. Most fitness trackers (Garmin, Oura Ring) use RMSSD to display HRV.
SDNN: Standard deviation of NN intervals. This metric is used to display HRV on Apple Watch.
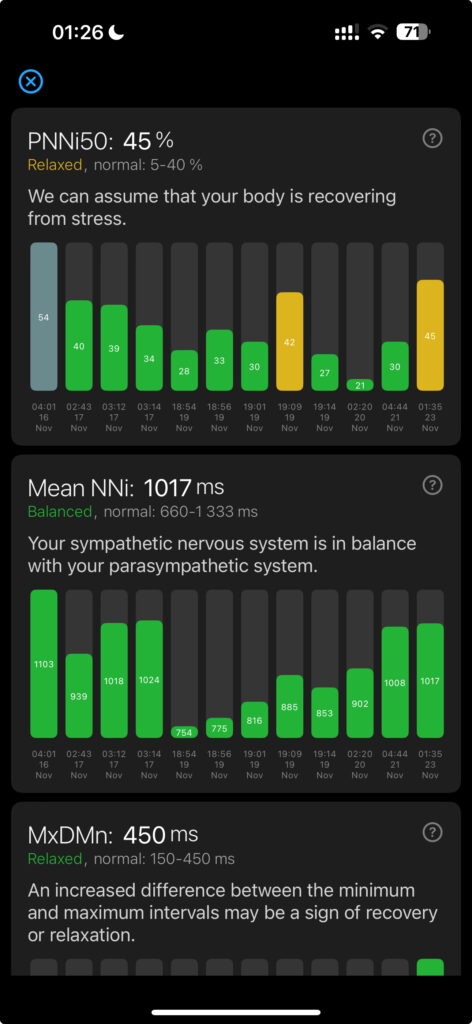
pNNi50: Percentage of NN intervals that differ by more than 50 ms. PNN50 is closely correlated with Parasympathetic Nervous System activity, which is responsible for the body’s “rest and digest” response.
MeanNNi: The average value of NN intervals (intervals between heartbeats). This value is usually inversely proportional to your heart rate. Higher values indicate that your body is at rest.
Mode: The interval between heartbeats, most common during the measurement.
AMo50: (Amplitude of Mode in 50ms bucket) Mode size in 50ms bucket. If all the intervals between beats are stacked at 50ms, this index will show the size of the highest stack, that is, it will show the ratio between the intervals lying within 50ms of the most frequent interval to the rest of the intervals.
CV: Coefficient of Variation. Higher values indicate better readiness of the body to cope with stress, but very high values may indicate fatigue.
MxDMn: (MaxDeltaMin): The difference between the longest and shortest intervals between heartbeats. Large values indicate that the body is in the process of recovery.
By the way, you can read all these descriptions and the definition of the value directly in the Wellhero app.
Metrics that are not currently displayed in our application and are less common in the literature:
HRV triangular index: Integral of the density of the RR interval histogram divided by its height.
TINN: Baseline width of the RR interval histogram.
HRV frequency-domain metrics
This analysis technique shows how much of the signal lies within certain ranges. Often Fast Fourier Transform (FFT) is used to obtain a partial frequency distribution.
| ULF power | ms2 | Absolute power of the ultra-low-frequency band (≤0.003 Hz) |
| VLF power | ms2 | Absolute power of the very-low-frequency band (0.0033–0.04 Hz) |
| LF peak | Hz | Peak frequency of the low-frequency band (0.04–0.15 Hz) |
| LF power | ms2 | Absolute power of the low-frequency band (0.04–0.15 Hz) |
| LF power | nu | Relative power of the low-frequency band (0.04–0.15 Hz) in normal units |
| LF power | % | Relative power of the low-frequency band (0.04–0.15 Hz) |
| HF peak | Hz | Peak frequency of the high-frequency band (0.15–0.4 Hz) |
| HF power | ms2 | Absolute power of the high-frequency band (0.15–0.4 Hz) |
| HF power | nu | Relative power of the high-frequency band (0.15–0.4 Hz) in normal units |
| HF power | % | Relative power of the high-frequency band (0.15–0.4 Hz) |
| LF/HF | % | Ratio of LF-to-HF power |
Currently, we do not calculate these metrics because their calculation requires a measurement duration ranging from 5 minutes to 24 hours (depending on the metric).
Used articles: