In version 1.0.1, we launched workout analytics that we’ve been working on recently.
An important detail: we analyze workouts from the perspective of cardiovascular and nervous system load. We don’t analyze sport-specific metrics like stroke count in swimming or power output in cycling, but we go quite deep into everything related to heart activity, energy expenditure, and overall impact on the body.
So, you enabled workout access and completed a training session. After the app analyzes the data, a card like this will appear in your feed:
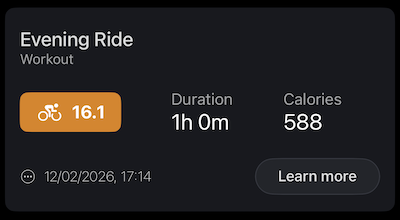
The number on the orange background is the workout Strain. We based our Strain scale on the Borg RPE scale, with some differences. Instead of the 6 to 20 range, we measure Strain from 0 to 21, where 21 is practically unreachable, since it’s a logarithmic value calculated from time spent in different heart rate zones.
The background color represents the TSB (Training Stress Balance) zone your body ended up in after the workout. In the example above, the number is orange because the post-workout TSB dropped more negative than planned, but more on that later.
Everything else here is fairly standard: workout duration and calories burned. We take these values directly from Apple Watch via Health, as is.
Let’s dive into the details of the post
Workout analytics and AI description
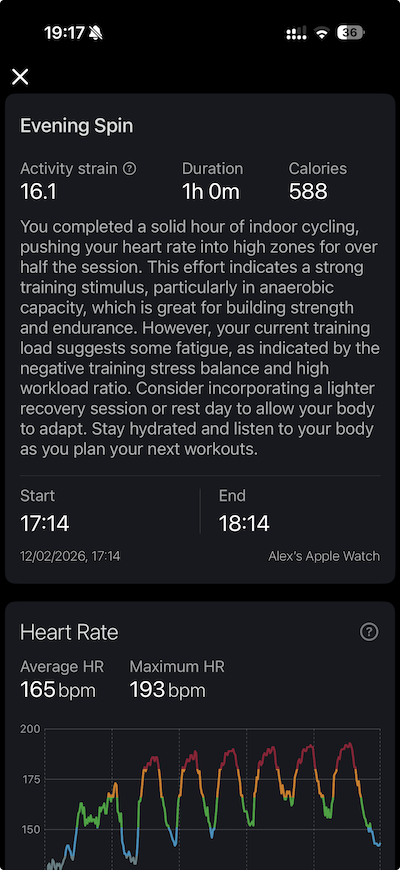
The beginning of the workout detail view mostly duplicates the feed card. The only difference is that we don’t color the Strain background, since there’s a separate TSB section further below. However, if you tap the question mark icon above Strain, you can read a more detailed explanation of it.
Next comes the workout description and its impact on the body. This text is generated by AI based on an anonymized user profile. For now, this feature is unlimited for both free and premium users. We’re monitoring the load and don’t rule out introducing limits on the free tier in the future, for example restricting the number of AI-analyzed workouts per month.
A bit lower, you can see the workout start and end time, as well as the device that recorded the session.
Heart Rate Chart & Zones
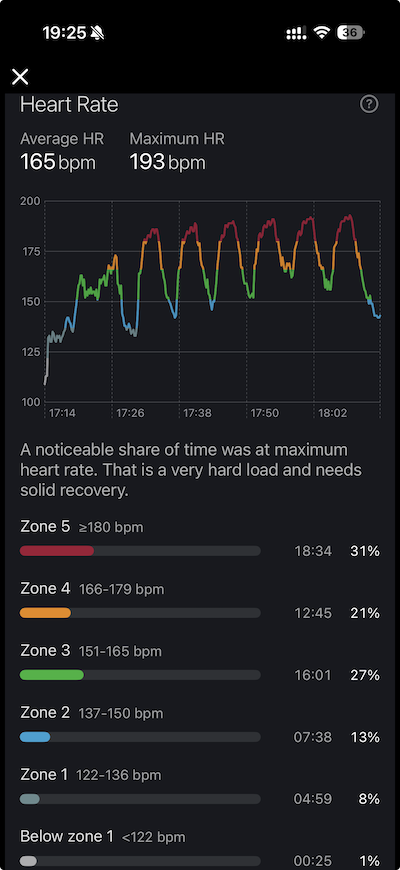
A bit lower, you’ll see the heart rate chart along with time spent in each heart rate zone. By default, we calculate zones using the heart rate reserve method. For this, we take your resting heart rate (the same one we use for recovery calculations) and your maximum heart rate, either estimated from your age or detected from workouts over the past year.
If you know your true maximum heart rate, or even your exact zone ranges, we recommend setting them manually in the settings, since max HR affects all metrics shown on this screen.
TRIMP & Training Stress Balance
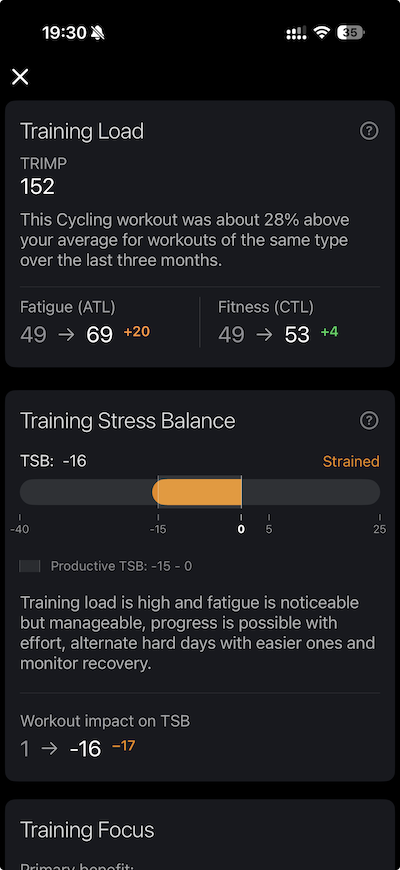
The next two sections are closely connected. We calculate and display Banister TRIMP (TRaining IMpulse), as well as its impact on Fatigue (Acute Training Load, ATL) and Fitness (Chronic Training Load, CTL).
The idea is simple: CTL reflects your fitness level, while ATL reflects fatigue from your current training load.
The higher your CTL, the more ATL you can tolerate during training without risking overtraining or negative consequences for your body.
The difference between CTL and ATL is what TSB represents. Negative TSB values indicate that your body is processing the current load, which is why having a positive TSB before competitions is important.
Training Focus & Heart Rate Recovery
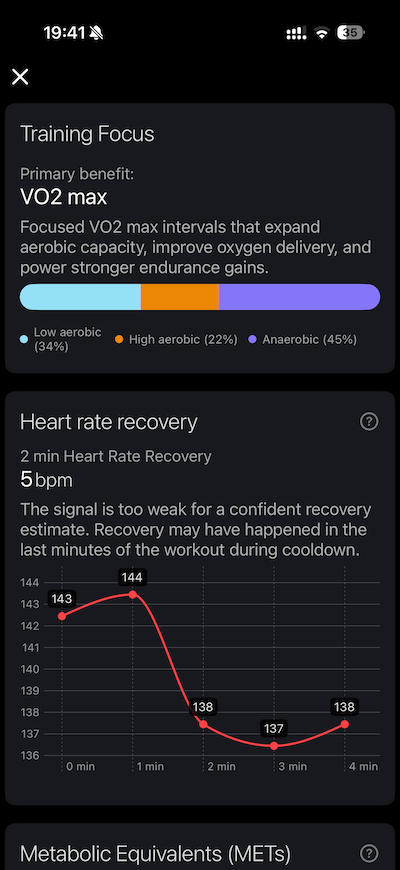
In Training Focus, we calculate TRIMP accumulated below the aerobic threshold as Low Aerobic, above the lactate threshold (LTHR) as Anaerobic, and everything in between as High Aerobic. The challenge is that these thresholds can only be measured precisely in a lab with a lactate test, so we provide our best possible estimation based on heart rate zones.
In the screenshot above, you can see my heart rate during an intensive VO2Max cycling workout (I did the Acquaviva session from the TrainerRoad app), and Wellhero did a fairly good job identifying the nature of the load.
In Heart Rate Recovery, we analyze heart rate after the workout has been stopped on the watch. Honestly, this is a somewhat imperfect metric for two reasons. First, to assess HRR at the 2-minute mark, the heart rate needs to be driven sufficiently high. Second, the heart rate shouldn’t already be dropping to normal during the final minutes of the workout. In this example, the graph looks a bit messy because TrainerRoad includes a fairly long cooldown after intense sessions, but even so, you can still see a small drop two minutes after I got off the trainer.
Metabolic Equivalents (METs)
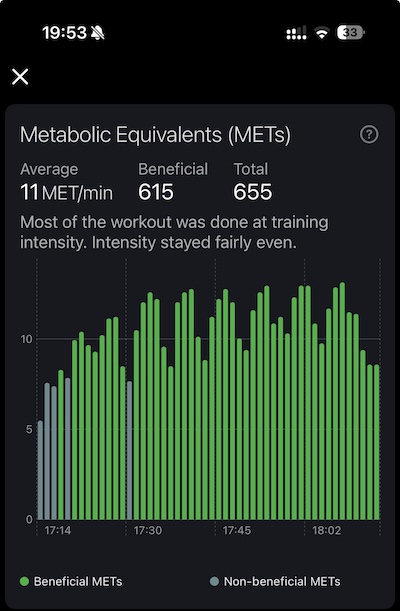
Metabolic Equivalents (METs) measure the energy cost of physical activities as a multiple of the resting metabolic rate. One MET equals the oxygen consumption of sitting quietly, defined as 3.5 mL/kg/min or 1 kcal/kg/hour. They are used to quantify exercise intensity: < 3 METs (light), 3–6 (moderate), and > 6 (vigorous).
METs are used to determine safe exercise levels for cardiac rehabilitation. For instance, increasing from a sedentary lifestyle to 5 METs of activity can improve health. They are also used to measure maximum aerobic capacity (VO2 max) in clinical settings.
Fats & Carbs Ratio
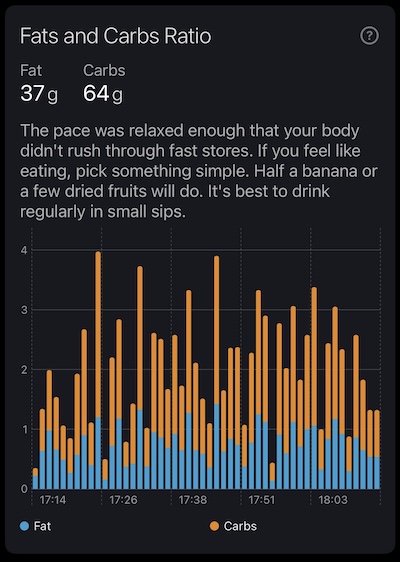
This chart shows the ratio of fats and carbohydrates burned during the workout. Of course, this is our best estimation based on the calories calculated by Apple Watch and time spent in different heart rate zones.
Even with this estimation, you can roughly project how many carbohydrates you might need during similar workouts or competitions and plan your fueling strategy accordingly. Or see that during Zone 2 training your body relies more on fat as an energy source.
Meta Information
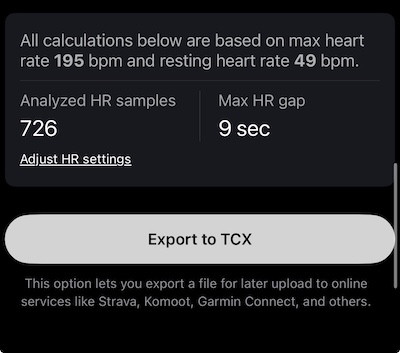
At the very end of the workout detail view, you’ll find diagnostic information showing how many times the watch recorded heart rate during the session and the maximum gap between heart rate samples.
For example, a value of 0 in Analyzed HR Samples may indicate that the app doesn’t have access to heart rate data yet, or that the workout hasn’t been fully processed. At the same time, the lower the Max HR Gap, the more accurate the data. In general, anything under 2 minutes is still considered usable.
There’s also an option to export the workout file in TCX format, which allows you to upload your Apple Watch workouts to many external services such as Strava or Garmin Connect.