
What is Strain? Understanding your daily load
By Wellhero ·
Strain is Wellhero's estimate of accumulated cardiovascular load on a 0–21 scale. It turns the intensity and duration of recorded activity into a score you can read alongside your recovery and recent history.
Wellhero calculates the score from data shared through Apple Health. The daily Strain describes activity across your day; Activity strain in a workout report describes that session.
This guide follows the screens in the app, with 14 screenshots and worked examples. The screenshots use fictional data and show PRO sections unlocked.
Where to find Strain in Wellhero
- Connect Apple Health in Wellhero and allow the heart rate and workout data used for analysis.
- Wear your Apple Watch during the day. Start a workout when you want that session to appear as a recorded workout.
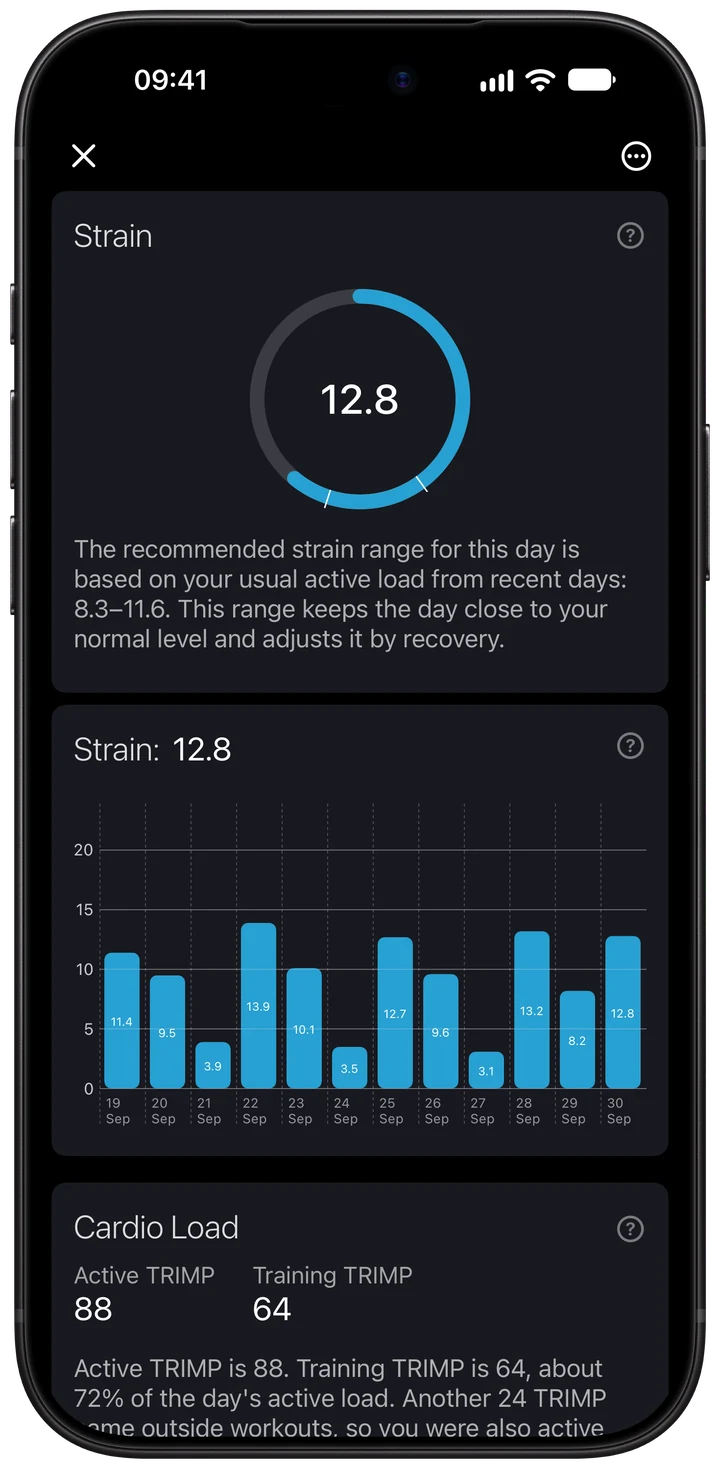
- Open the Today overview in your Wellhero feed and tap the Strain card.
- Read the current score and range, then scroll through the history, Cardio Load, ATL & CTL, TSB and Workload Ratio.
- Tap a question mark beside a chart to open its explanation.
Jump to the 0–21 scale, daily vs workout Strain, Active and Training TRIMP, the personal range, ATL/CTL or common questions.
Why the 0–21 scale is nonlinear
Longer activity and a higher relative heart rate can accumulate more TRIMP, the load measure behind Strain. Wellhero maps that load onto a bounded scale, with a small adjustment for your longer-term training background.
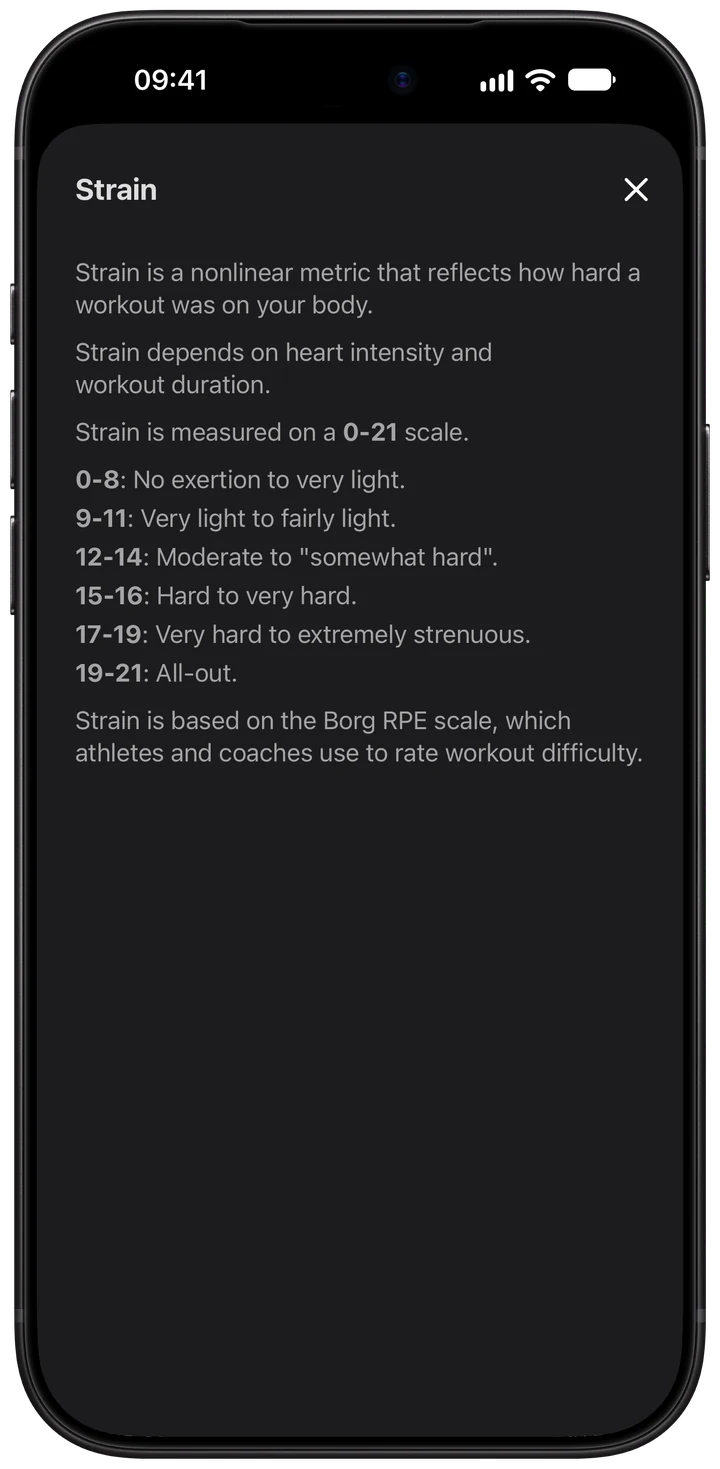
The score rises more slowly near the top. A score of 16 does not mean twice the load of 8, and two sessions with Strain 8 do not add up to daily Strain 16.
For example, with the same training background, TRIMP values of 30, 60 and 120 produce approximately Strain 6.3, 10.3 and 15.0 in the current calculation. Doubling the underlying load does not double the score.
Use the scale to summarize load. Open the TRIMP and heart rate views when you want to understand how that load accumulated.
Daily Strain and workout Strain describe different amounts of activity
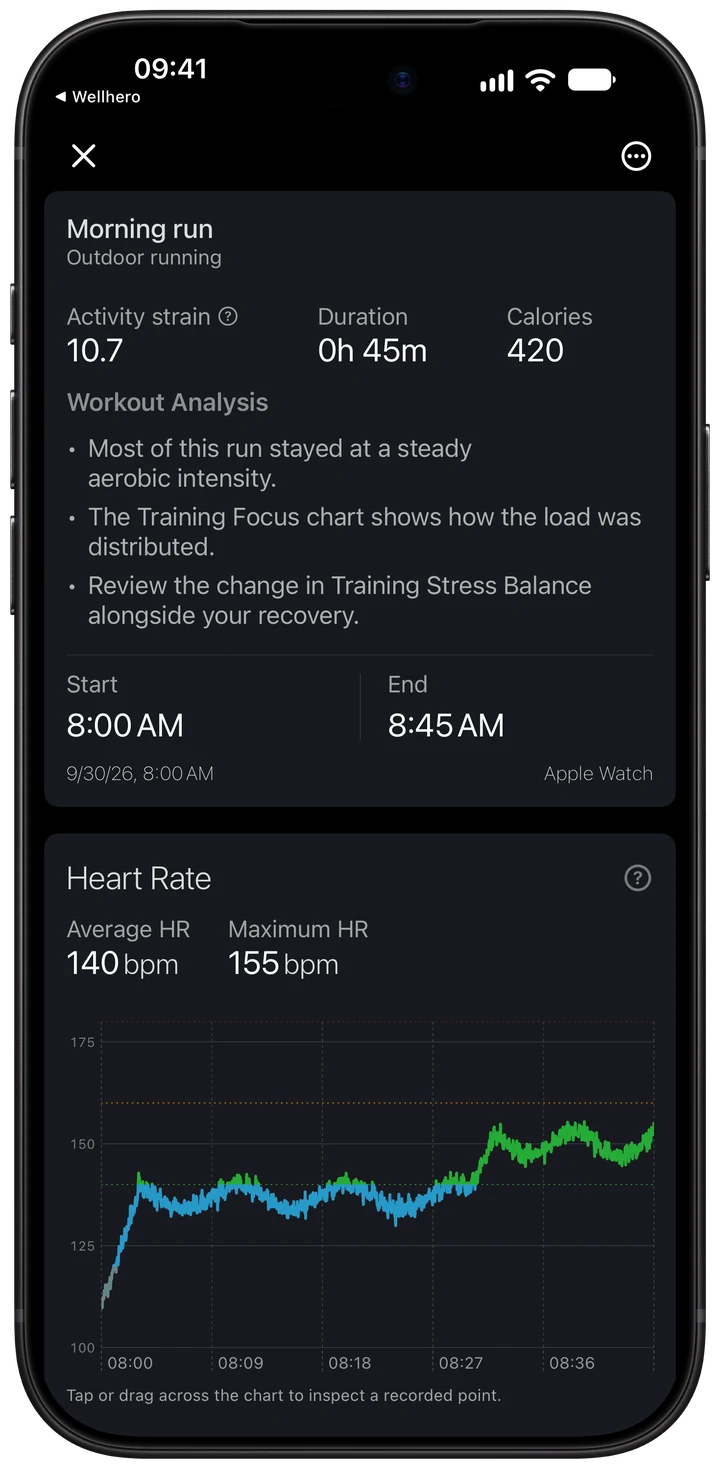
The workout report calculates Activity strain for that session. Daily Strain uses active load across the day, including activity outside recorded workouts.
In these examples, the run has TRIMP 63.7 and Activity strain 10.7. The day has Active TRIMP 88 and Strain 12.8. Activity outside the recorded run contributes to the day's load.
The daily value comes from accumulated load. It is not the sum of the scores shown on individual workout cards. Compare the underlying TRIMP when checking how much a workout contributed.
For pulse charts, zones, Training Focus and post-workout readings, see the Apple Watch workout analysis guide.
Use the history to read the pattern
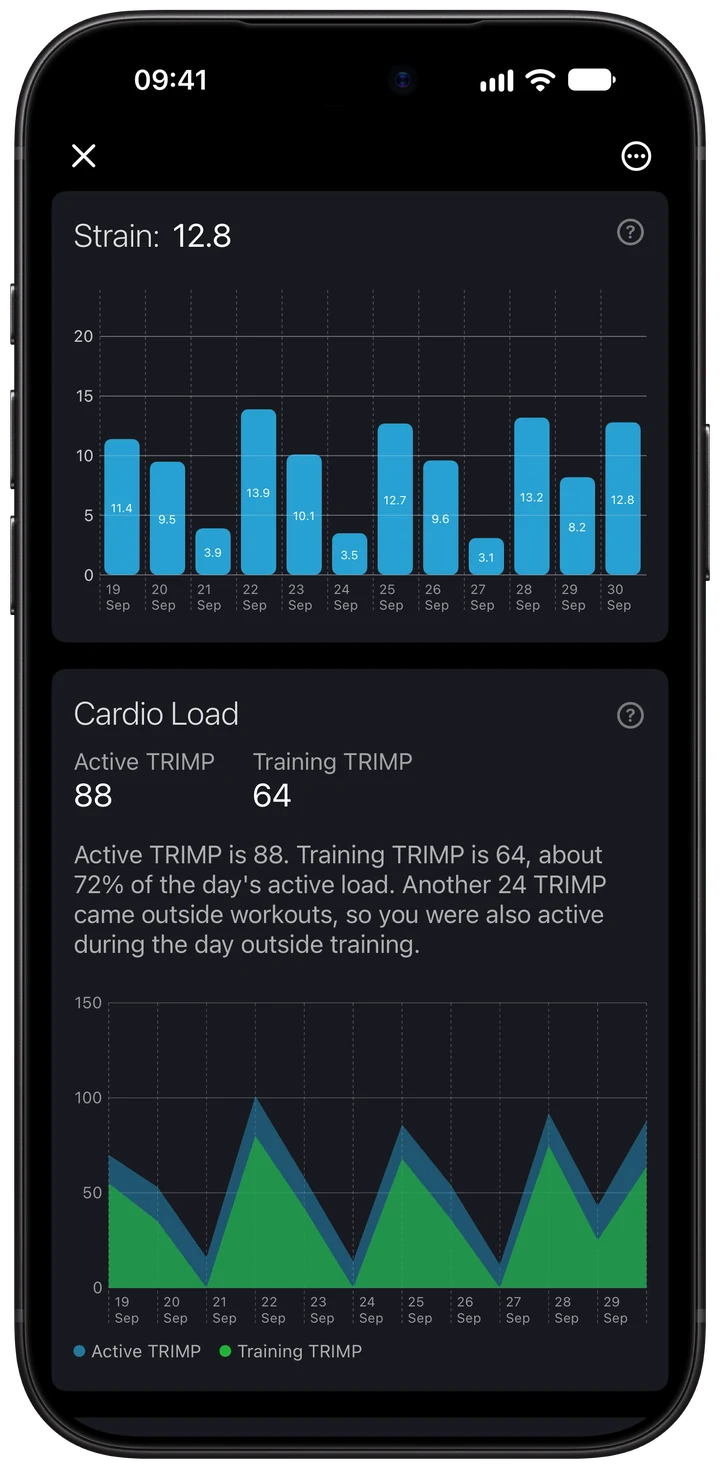
The Strain history shows how load varied across recent recorded days. A single score describes one day; the chart shows how that day sits among easier and heavier days.
Check dates and data coverage before comparing bars. A low value can reflect a quieter day, limited watch wear or incomplete synchronization. It does not explain the cause by itself.
Look for changes that match your recorded activities. If the pattern surprises you, scroll to Cardio Load and check whether it came from recorded training or other activity.
Active TRIMP and Training TRIMP
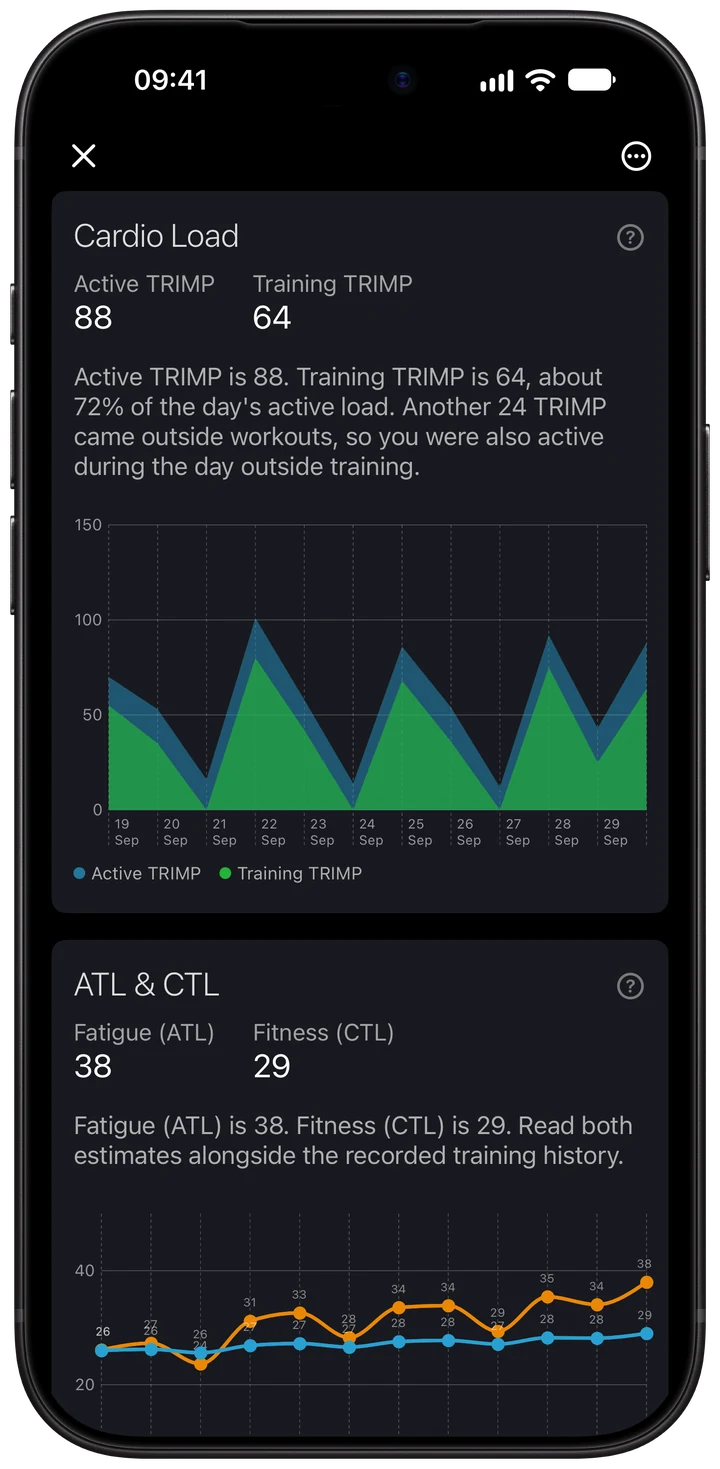
TRIMP means Training Impulse. It weights activity duration by heart rate intensity relative to the heart rate limits used for analysis. Higher intensity contributes more load per minute.
Active TRIMP captures physically active periods across the day. Training TRIMP captures load associated with recorded workouts. The Cardio Load chart displays the two series together.
They overlap. Training TRIMP is not an extra quantity to add to Active TRIMP. In this example, 63.7 of the day's 88 Active TRIMP comes from recorded training, leaving about 24 outside the workout.
Walks, physical work or an activity you did without starting a workout can contribute to the active total when suitable data is available. The two lines help explain why daily Strain can rise without another workout card.
Check which activity was actually recorded
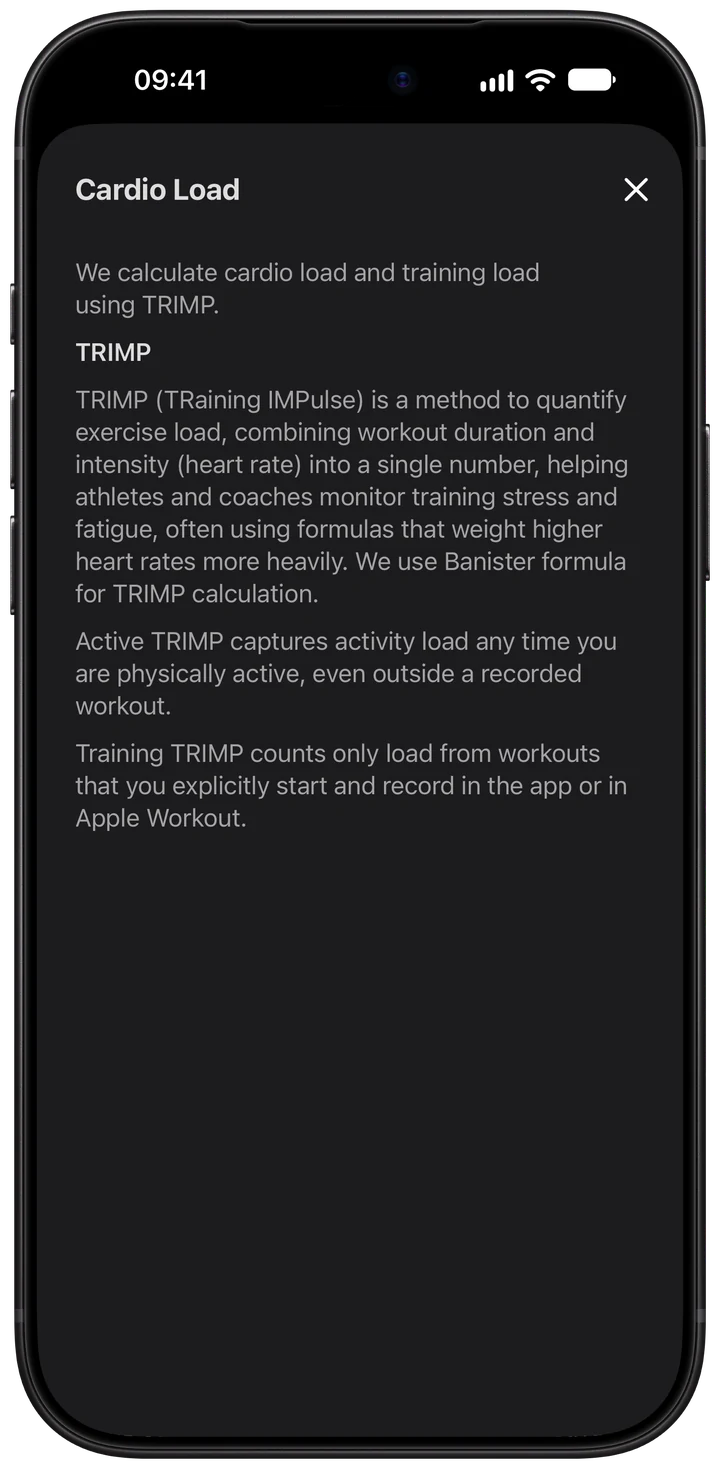
A large gap between Active and Training TRIMP can be useful context. Check whether you recorded the activity as a workout and whether that workout has finished syncing.
Compare the dates, duration and pulse recording in Apple Health and Wellhero. A missing workout record can change the split shown here even when heart rate readings are present.
When a chart looks incomplete, inspect synchronization from Profile → Apple Health Data → Health Status → Workouts. Workout records and their pulse samples can arrive at different times.
Why equal durations can produce different Strain
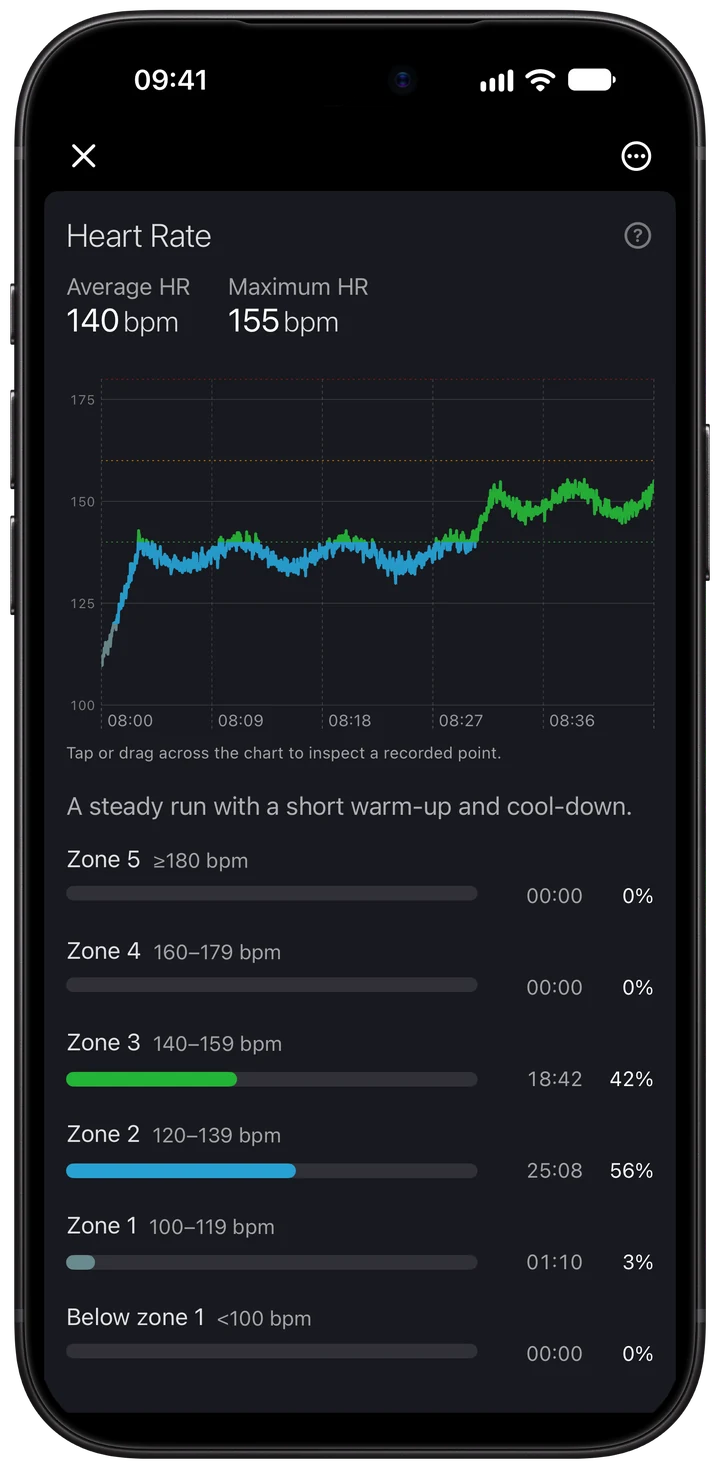
Two 45-minute sessions can have different heart rate profiles. More time at higher relative intensity can accumulate more TRIMP, even when the duration is identical.
Open the workout's pulse trace and zone distribution to see when intensity changed. The average pulse alone can hide short, harder sections.
The calculation also depends on the maximum and resting heart rate values used for analysis. You can inspect these in the workout report and open Heart Rate Settings from its diagnostics section.
Calories, steps and Strain describe different aspects of activity. Strain is a cardiovascular load estimate, so equal calorie totals need not produce equal scores.
The personal range changes with load history and Recovery
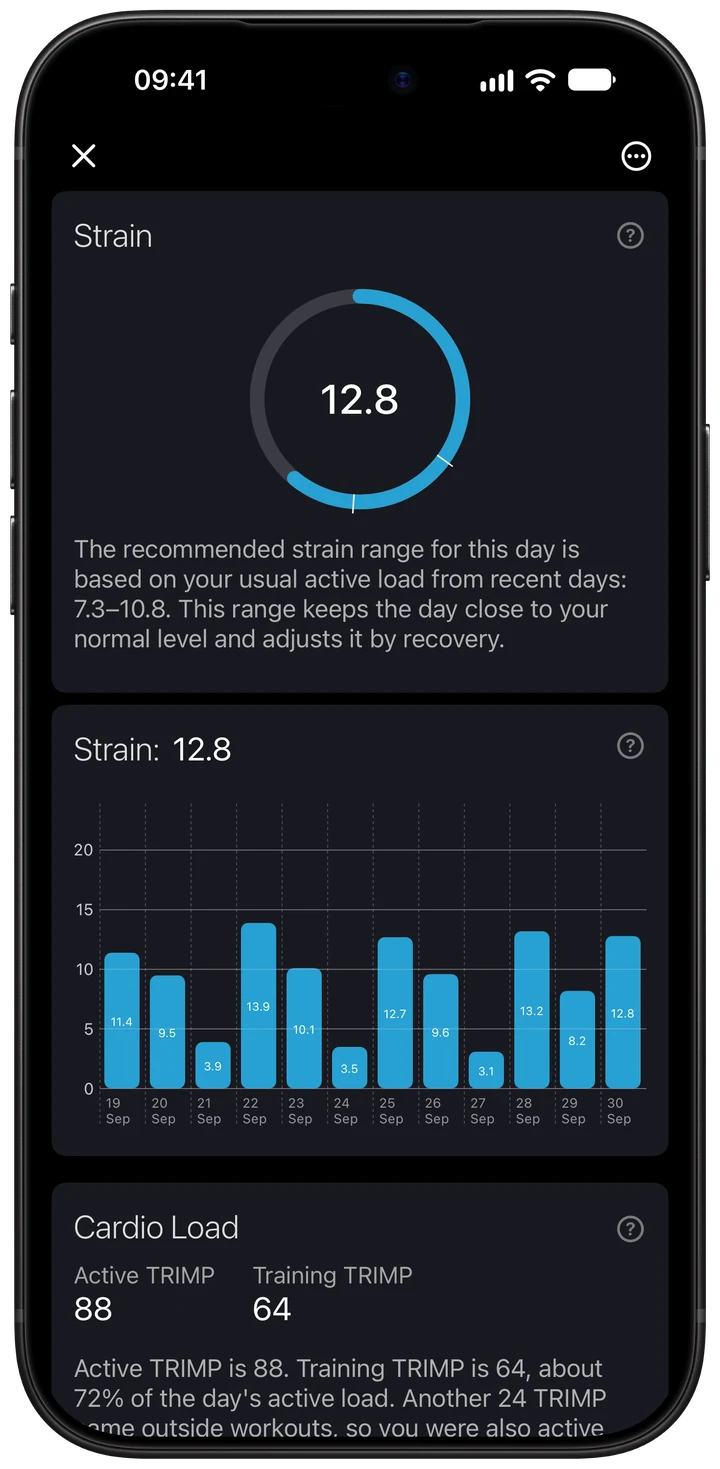
The markers on the ring show a recommended range for that day. Wellhero uses recent active-load patterns, the balance between shorter- and longer-term activity load, and the available Recovery reading to calculate it.
With less recent active-load history, the app can use the shorter- versus longer-term load balance as a fallback. If the required background is unavailable, a personal range may not be available.
Compare the first screenshot with this one. The fictional day has the same Active TRIMP 88 and Strain 12.8 in both. With Recovery 72, its range is 8.3–11.6. With Recovery 20, the range becomes 7.3–10.8.
Recovery changes the context for the day's load; it does not rewrite the recorded Strain. The top of the arc is guidance from the app's model. Reaching it is not a daily requirement.
ATL and CTL put training into a longer view
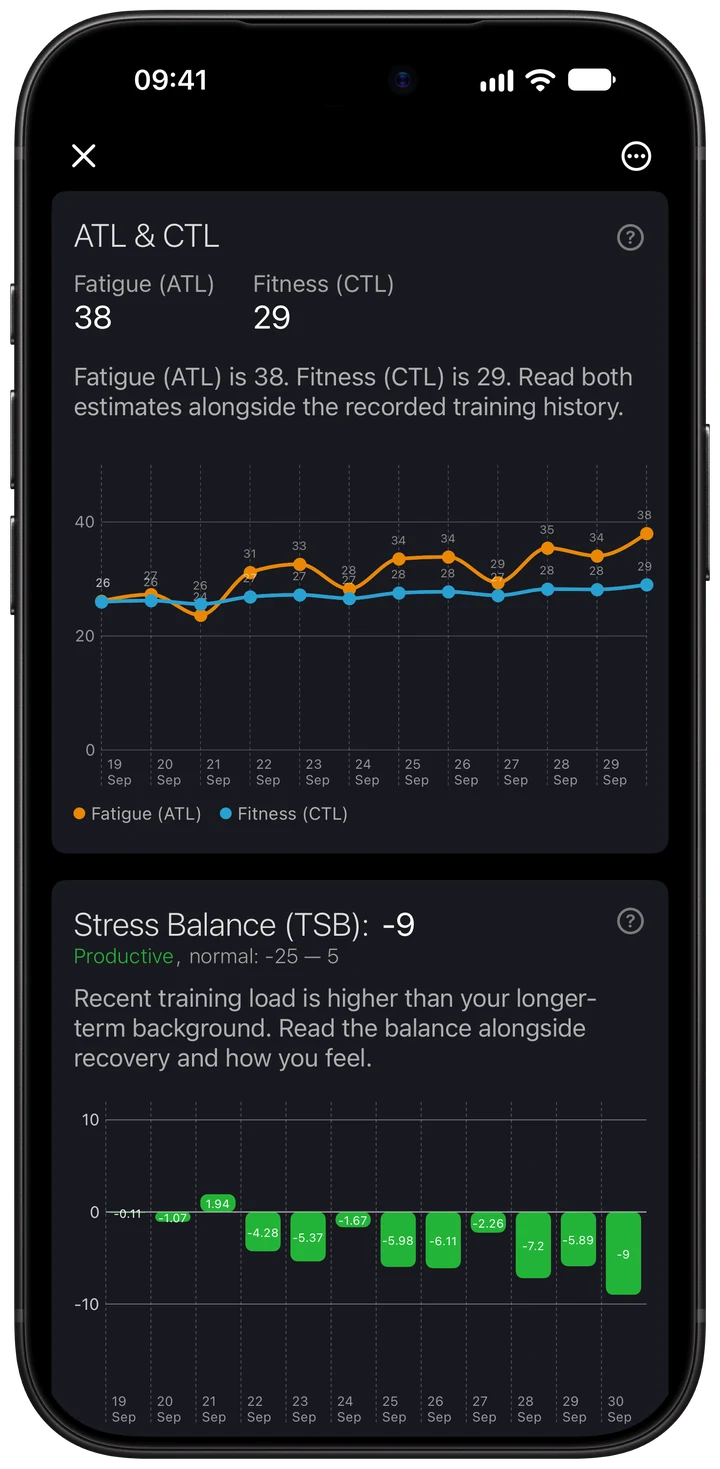
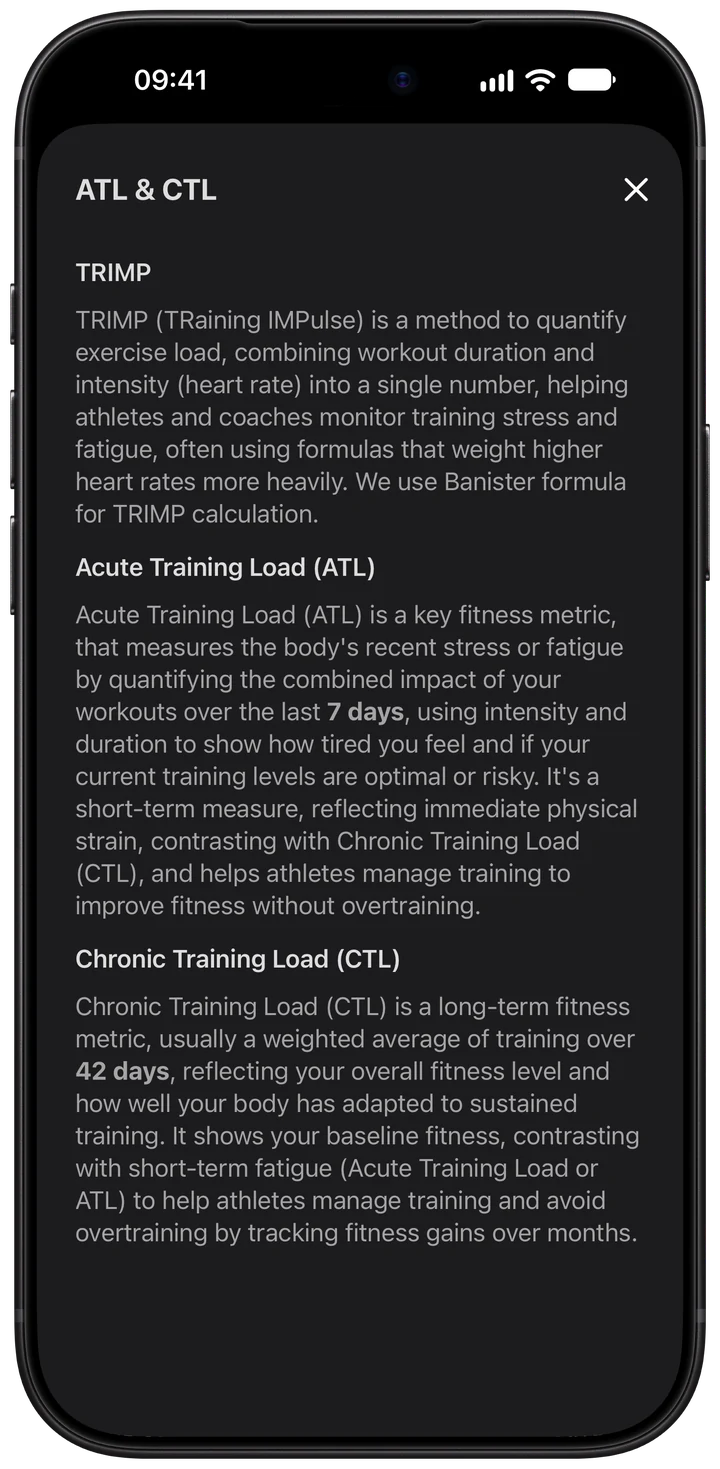
Acute Training Load (ATL), labeled Fatigue, uses a seven-day time constant. Chronic Training Load (CTL), labeled Fitness, uses a 42-day time constant. Both are weighted estimates from recorded training load.
The time constants control how quickly the estimates respond. They are not rigid windows that discard all older days at once. Recent training affects ATL more quickly, while CTL changes more gradually.
The labels summarize a load model. ATL does not directly measure tiredness, and CTL does not measure every aspect of fitness. Read the lines alongside the sessions that produced them.
A new account or incomplete history provides less background. Changes in recording coverage can also affect what these estimates represent.
Compare the lines with the Cardio Load chart
Start with the daily load series, then look at how the shorter- and longer-term estimates changed. A few heavier sessions can move ATL faster than CTL; an easier period can let recent load fall.
The daily Strain score, the personal range and the displayed training-history charts use related inputs for different purposes. Read their labels and explanations rather than treating them as interchangeable scores.
Use consistent recording and heart rate settings when comparing periods. The result is only as complete as the activity history available for analysis.
TSB describes the difference between CTL and ATL
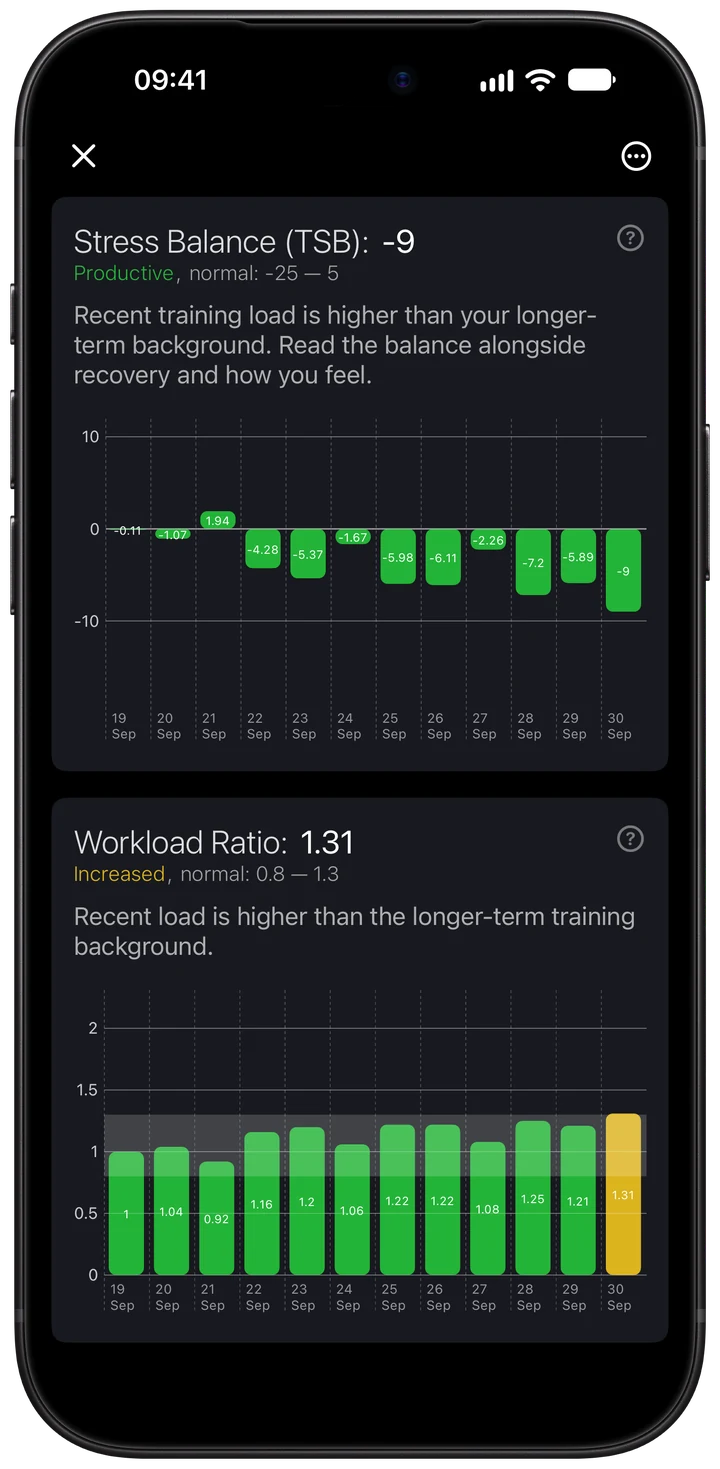
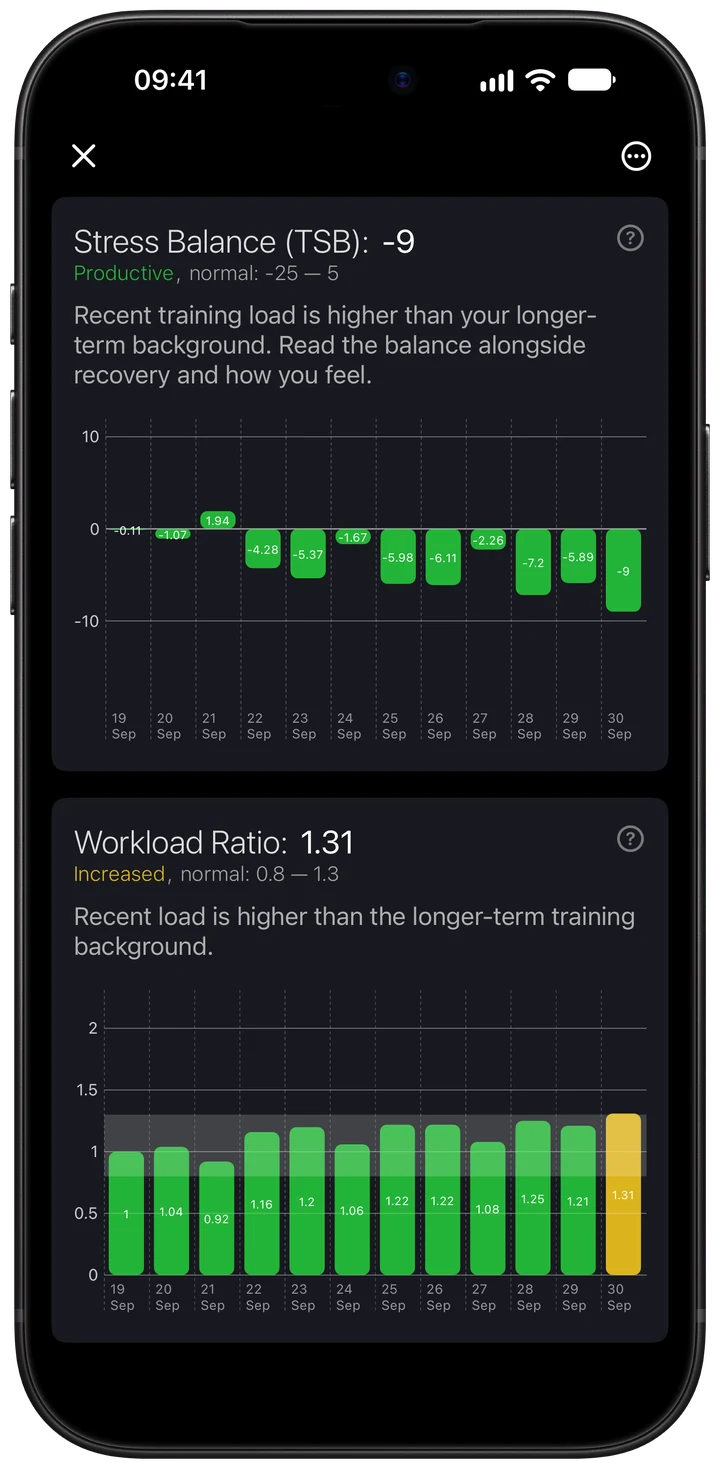
Training Stress Balance (TSB) = CTL − ATL. A negative value means recent load is higher than the longer-term background in this model. A positive value means recent load is lower.
The screen shows the history, current value and the interpretation supplied for the selected day. Use the trend to understand whether recent load is moving up or easing.
A higher TSB can follow an easier period. It does not automatically mean better fitness or guarantee that a demanding workout will feel easy. Check your Recovery readings and the surrounding activity history.
Check the recording behind the result
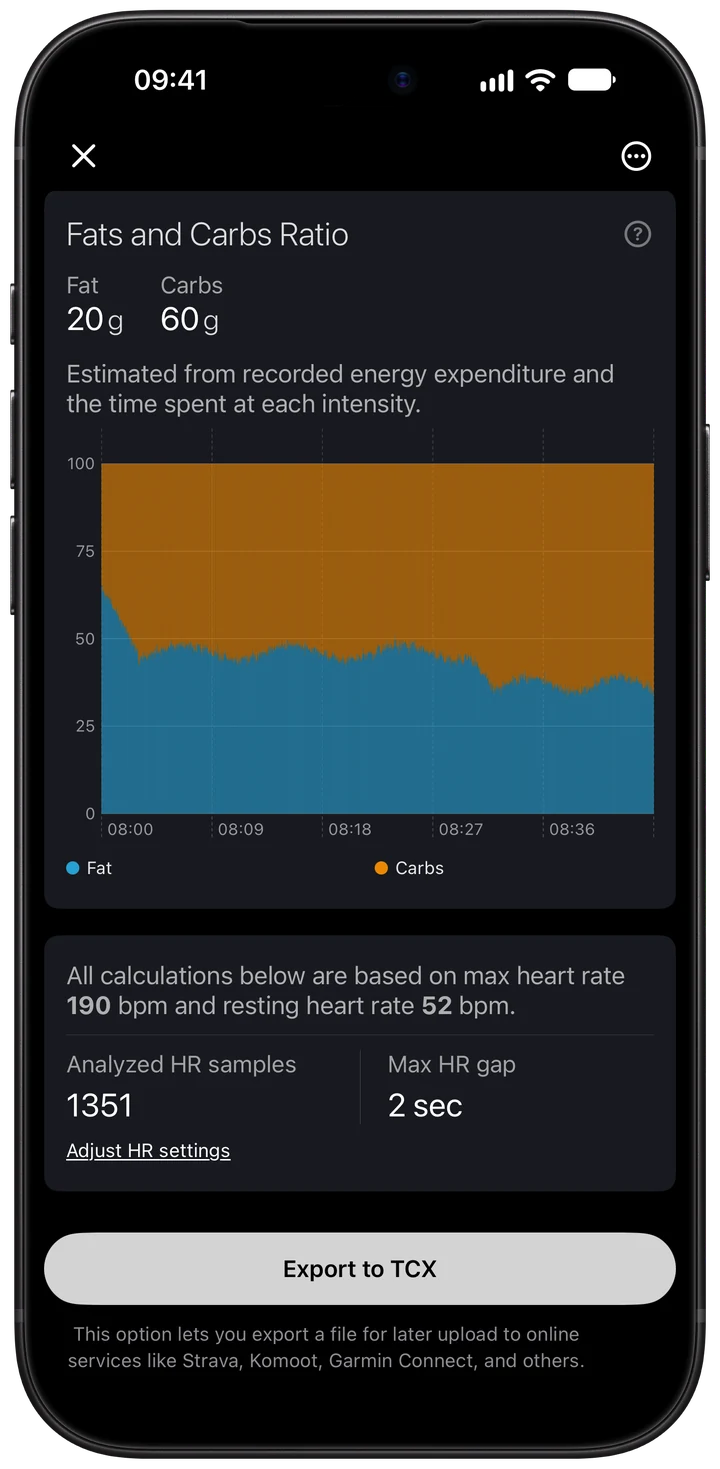
The workout report shows the number of analyzed heart rate samples, the longest gap between them, and the maximum and resting pulse used for calculations. Open Heart Rate Settings from the same section to inspect your limits.
Use these fields when a session's load surprises you. Sparse pulse readings, a gap in the recording or different settings can affect the comparison with another workout.
Keep the two ranges separate: the Strain ring concerns accumulated load for a day, while the TSB chart describes the difference between shorter- and longer-term training load.
Workload Ratio compares ATL with CTL
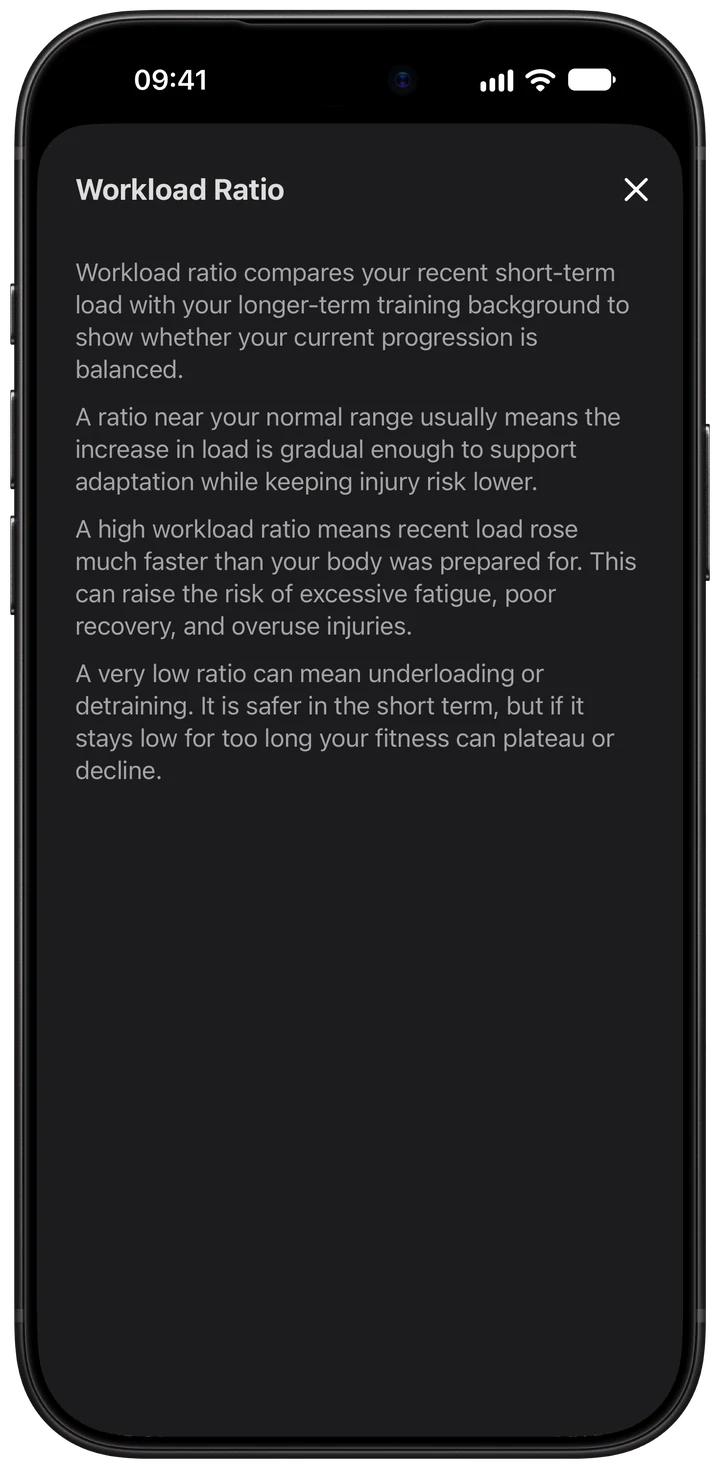
Workload Ratio = ATL ÷ CTL. Near 1, the two estimates are similar. Above 1, recent load is higher; below 1, it is lower. The ratio needs a usable longer-term baseline.
In this example, 38 ÷ 29 is approximately 1.31. The chart shows the ratio over the recorded days alongside its reference band.
TSB and Workload Ratio use subtraction and division to describe the relationship between the two estimates. They answer related questions, but their numbers and units differ.
Pay attention to changes in the ratio and to the recorded sessions behind them. A high ratio after limited history can reflect a small baseline as well as a rise in recent training.
Use the load model with your Recovery context
The app's labels describe how recent recorded load compares with your background. They are not a prediction of injury or a complete measure of physical recovery.
Review the day's Strain and range, then its load history, Recovery and sleep report. If a number is unexpected, check the recording context before drawing a conclusion from it.
The useful comparison is your own history under similar recording conditions. Another person's Strain, CTL or ratio may come from a different activity history and heart rate settings.
Common questions about Strain
What is a good daily Strain score?
There is no single target in Wellhero for every person and day. Start with the range shown for your selected day, its explanation and your current Recovery. A bigger score means more modeled load; it is not a grade for the day.
Why can Strain rise on a day without a workout?
Daily Strain includes physically active periods outside recorded workouts. Compare Active TRIMP with Training TRIMP to see the split, then check whether the activity was recorded and synchronized.
Does Strain measure mental stress?
Strain is based on activity load. Wellhero's HRV-based Stress and Autonomic Balance readings describe a different part of the app. A change in one reading does not identify its cause.
Is Strain the same in every app?
Apps can use different inputs, time periods, personal baselines and mappings. This guide describes Wellhero's TRIMP-based score. Compare its values with your Wellhero history rather than assuming another app's score has the same meaning.
Why is today's Strain low or missing?
Check watch wear, Apple Health permissions and synchronization. A low or absent recorded load may reflect limited data. It does not prove that you had no activity.
Do I need PRO for these screens?
The daily Strain summary, Strain history and Cardio Load chart can be read without PRO. ATL & CTL, TSB and Workload Ratio detail charts require PRO. Access to older days has its own limits, shown in the app.
Can I add my workout Strain scores together?
No. The 0–21 mapping is nonlinear. Daily Strain is calculated from accumulated active load; adding the displayed scores would produce a different number.
What should I check before comparing two days?
Check available heart rate samples, recorded workouts, the time of the reading, heart rate settings and the surrounding history. A partly synchronized day and a complete day provide different coverage.
Read your next day's Strain with its context
Open the Strain card, review the score and marked range, then check Cardio Load and the recent history. Connect the readings to the activities you recorded and your Recovery for that day.
Get Wellhero on the App StoreContinue with workout analysis, Recovery tracking or sleep analysis.