
Apple Watch workout analysis
Understand the load behind your workout. Wellhero brings Strain, heart rate zones, training load and recovery readings into one report on your iPhone.
Record a session with Apple Watch, let it sync through Apple Health and open the workout in Wellhero. Start with the summary, then explore how the session changed your recent training load.
These 13 screenshots show the current app with a fictional 45-minute run. PRO sections are shown unlocked. Your report depends on the measurements available in Apple Health; AI availability and usage limits are shown in the app.
Get Wellhero on the App Store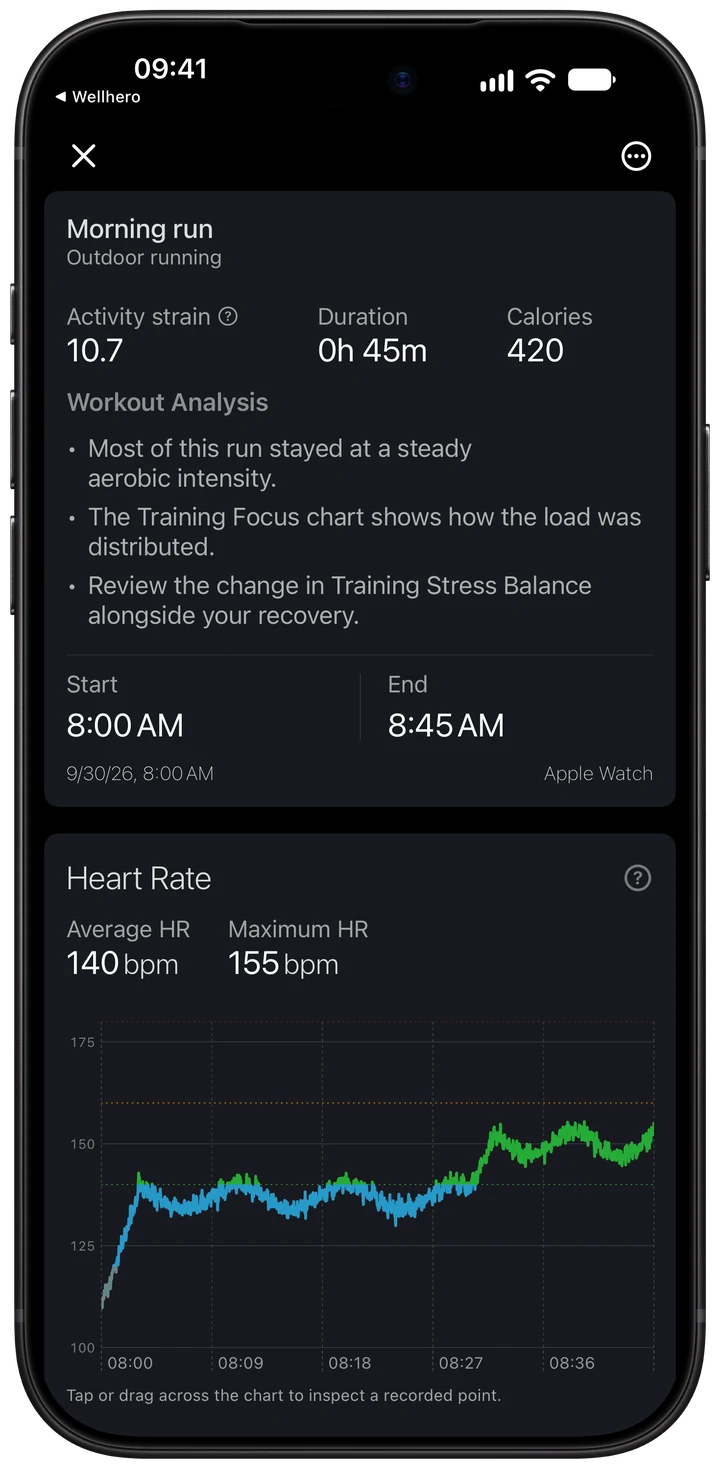
How to analyze an Apple Watch workout in Wellhero
- Connect Apple Health. Install Wellhero on the iPhone paired with your watch. Allow access to workouts and the heart rate data needed for the report.
- Record your session. Start and stop a workout on Apple Watch. A compatible recording app can also supply a workout through Apple Health.
- Let the data sync. Check that the session and its heart rate readings appear in Apple Health. Workout details and heart rate samples can arrive at different times.
- Open the recent workout card. Tap the workout in your Wellhero feed. Check its title, duration, start and end time, and recording source.
- Read the report in order. Review Strain and the pulse trace, then Training Load, TSB and Training Focus. Use the question mark buttons for the app's explanations.
Jump to Strain, heart rate, TRIMP and training load, TSB, Training Focus or data quality and export.
The written Workout Analysis adds context to the recorded session. If it is still processing or a usage limit has been reached, the app shows that status. Read the metric sections that are available while the text is being prepared.
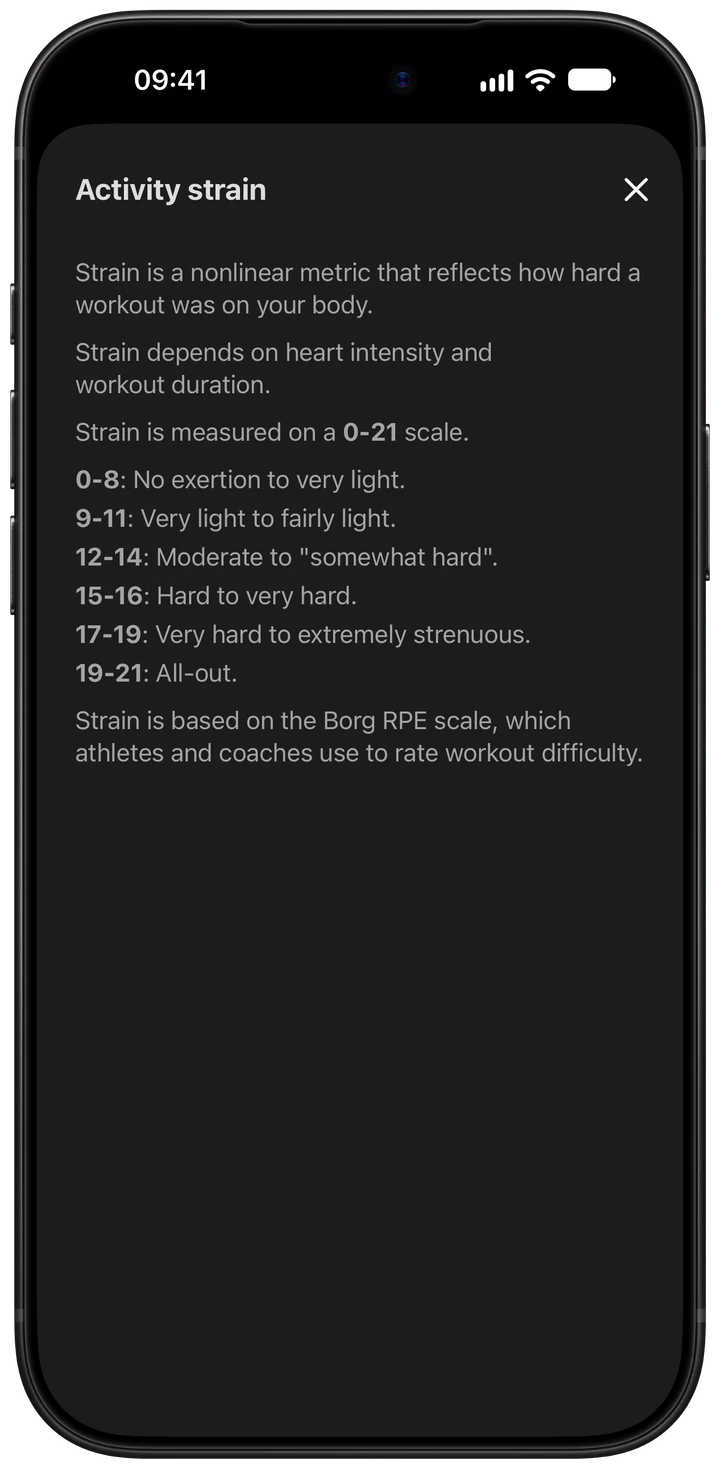
Workout Strain: the load from this session
Strain is Wellhero's estimate of a workout's cardiovascular load on a scale from 0 to 21. It uses TRIMP, which combines heart rate intensity and duration, with an adjustment for your training background.
The scale is nonlinear. Adding two workout scores will not give the Strain of the combined activity, and a score of 16 does not mean twice the load of 8. Compare sessions alongside their duration, heart rate and Training Load.
The workout score describes this recorded session. The daily Strain in your Today overview includes activity across the day, including activity outside recorded workouts. Keep the session score and the daily total in their respective contexts.
Read the complete Strain guide for the 0–21 scale, daily history, Cardio Load and personal ranges.
In the summary, duration and calories come from the recorded workout. Strain summarizes its load. These fields answer different questions, so sessions with similar calories can have different Strain.
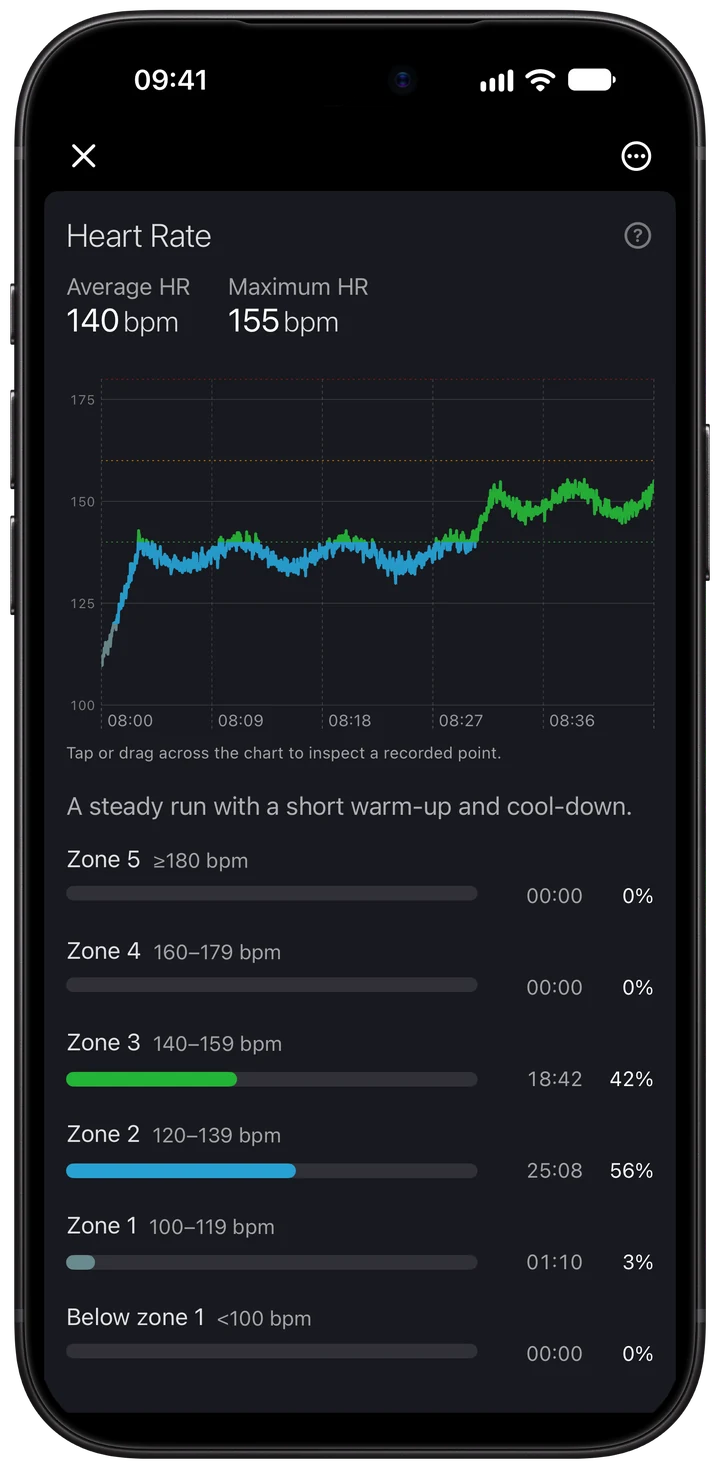
Heart rate: see the shape of the workout
The Heart Rate section shows average and maximum pulse in beats per minute, followed by the recorded timeline. The colors identify heart rate zones; the shaded reference band helps you read the trace against the configured zone boundaries.
Tap or drag across the chart to inspect a point and its time. Check the warm-up, steady sections, intervals and finish. An average can hide short hard efforts that are visible in the timeline.
Missing or sparse readings reduce the detail available for analysis. Use the recording diagnostics further down the report to check how many samples were analyzed and the longest gap between them.
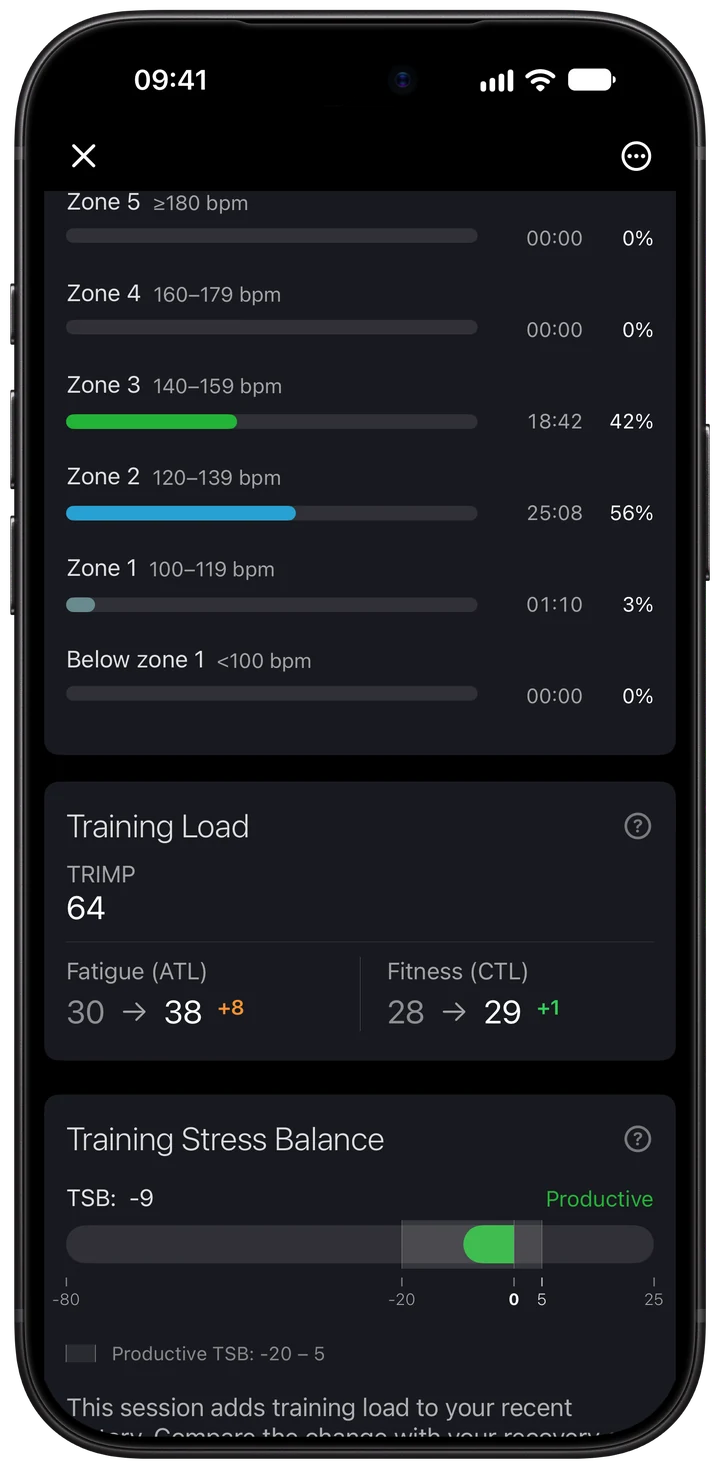
Heart rate zones: where the time went
The zone distribution summarizes time below Zone 1 and in Zones 1 through 5. Read each zone's duration, percentage and displayed pulse boundaries together.
This view helps you distinguish a steady session from one with more time at higher intensity. The timeline shows when those efforts happened; the distribution shows how much recorded time each zone accounts for.
Zone boundaries are part of your heart rate settings. The report's Heart Rate Settings shortcut lets you inspect the limits used by the app. Check those settings when zones seem inconsistent with your recorded pulse.
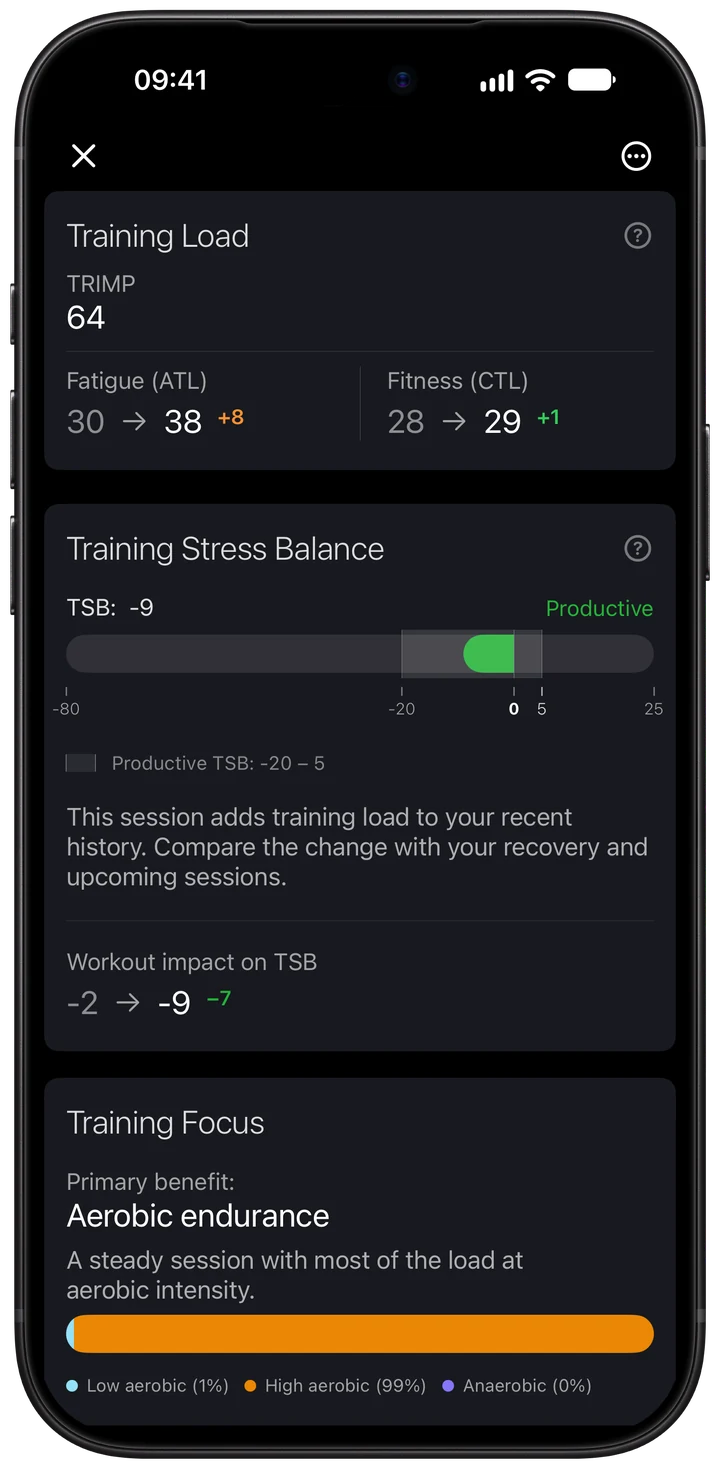
Training Load: TRIMP, ATL and CTL
TRIMP, or Training Impulse, combines recorded duration and heart rate intensity into one load value. Wellhero uses the Banister method, which weights higher heart rate intensity more heavily.
Fatigue (ATL) is a summary of recent training load using a seven-day time constant. Fitness (CTL) summarizes the longer training background using a 42-day time constant. Both are weighted load estimates that depend on your recorded history.
The report shows the values before and after the workout, with the change alongside them. Read the direction and size of the change over several sessions. ATL and CTL describe recorded load history; they do not measure every aspect of how you feel.
Fresh accounts and incomplete history provide less context for these values. Check data coverage before comparing them with a period that has a fuller recording history.
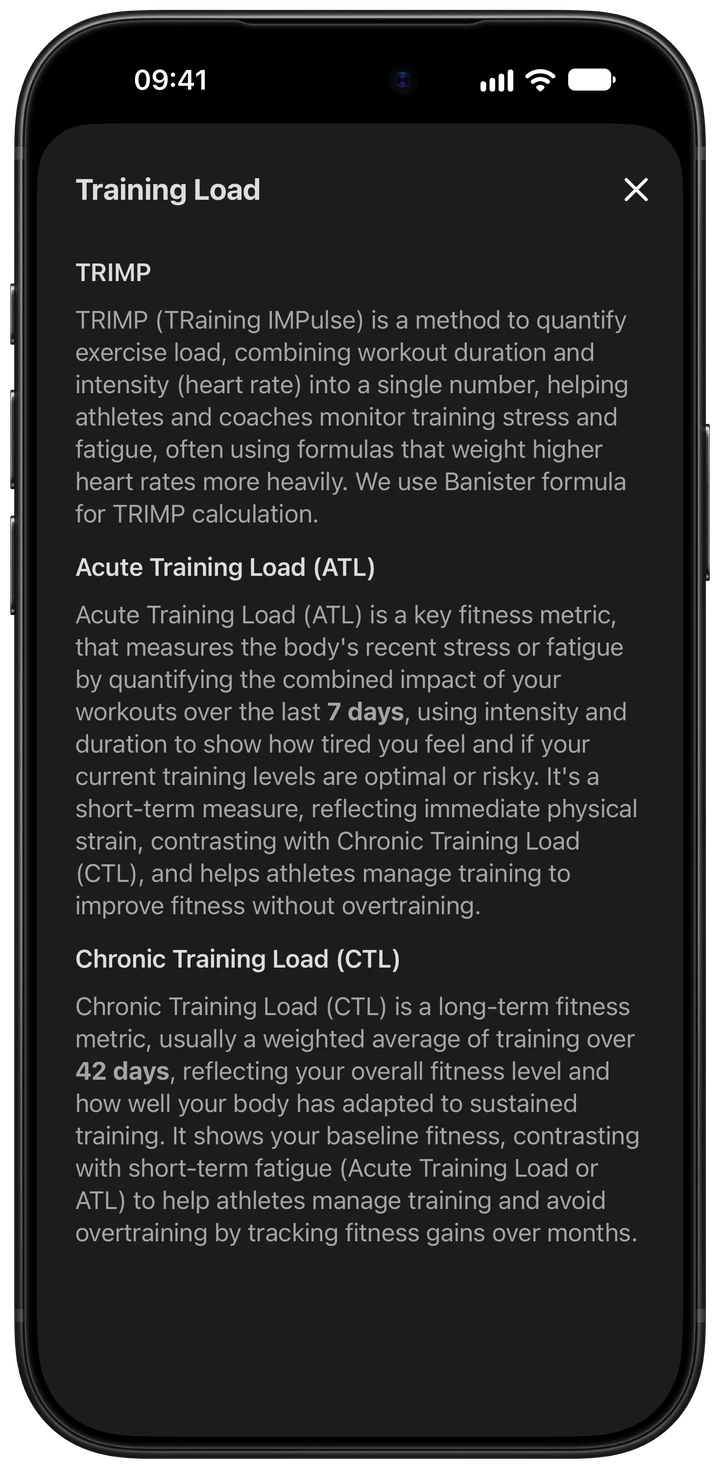
Use TRIMP to compare recorded sessions
A longer session at lower intensity and a shorter session at higher intensity can produce similar TRIMP. Open the pulse timeline and zone distribution to understand how each session accumulated that load.
Keep the measurement context consistent: recording device, available heart rate data and configured heart rate limits all matter. A gap in the pulse record can change the evidence behind the result.
Tap the question mark beside Training Load to read the method explanation while reviewing your workout.
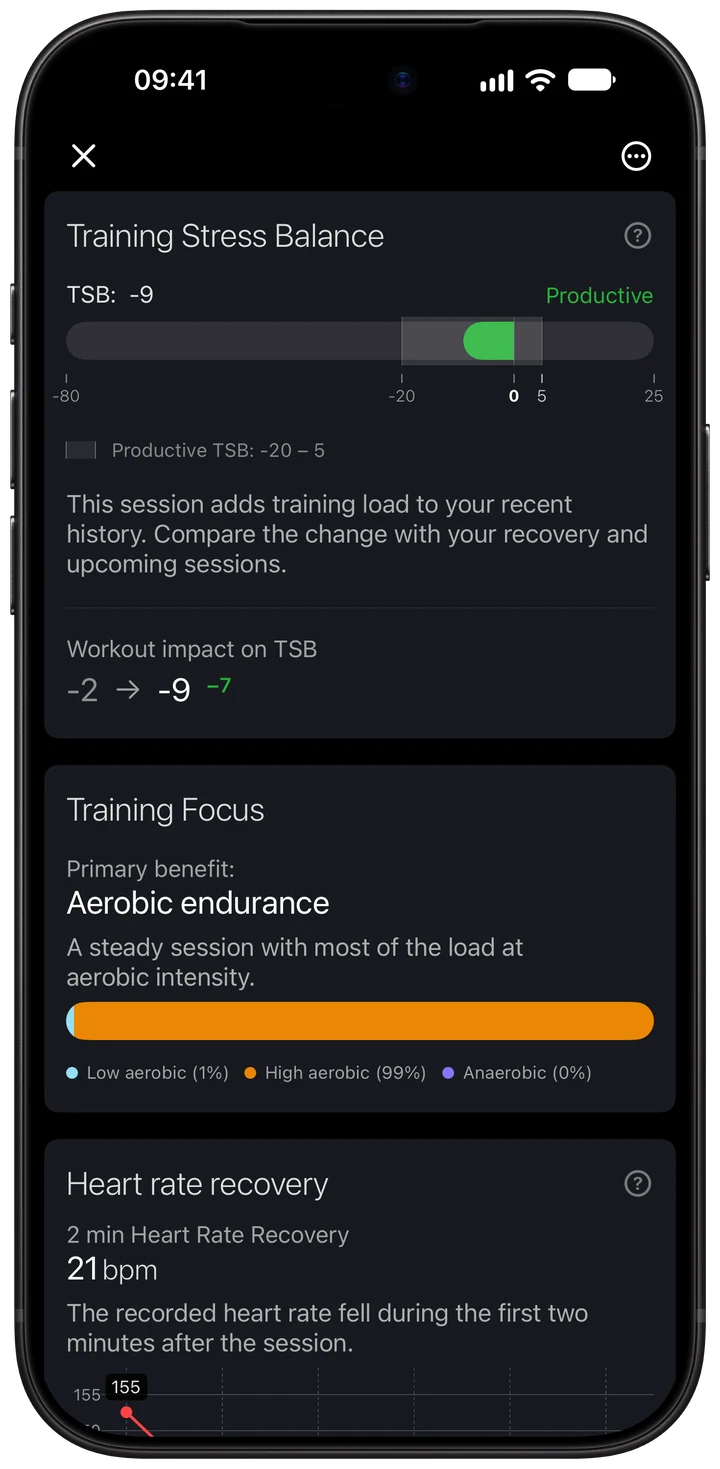
Training Stress Balance: how the load fits your history
TSB is the difference between CTL and ATL. When recent load rises relative to your longer training background, TSB becomes lower. As recent load eases, the balance can move higher.
The report shows the resulting value, its status, the displayed productive range and the change caused by the workout. In this demonstration, CTL of 29 and ATL of 38 give a TSB of −9.
Read TSB alongside your recent training, recovery readings and how you feel. The label describes the app's load model. A higher value on its own does not establish that you are ready for a hard session.
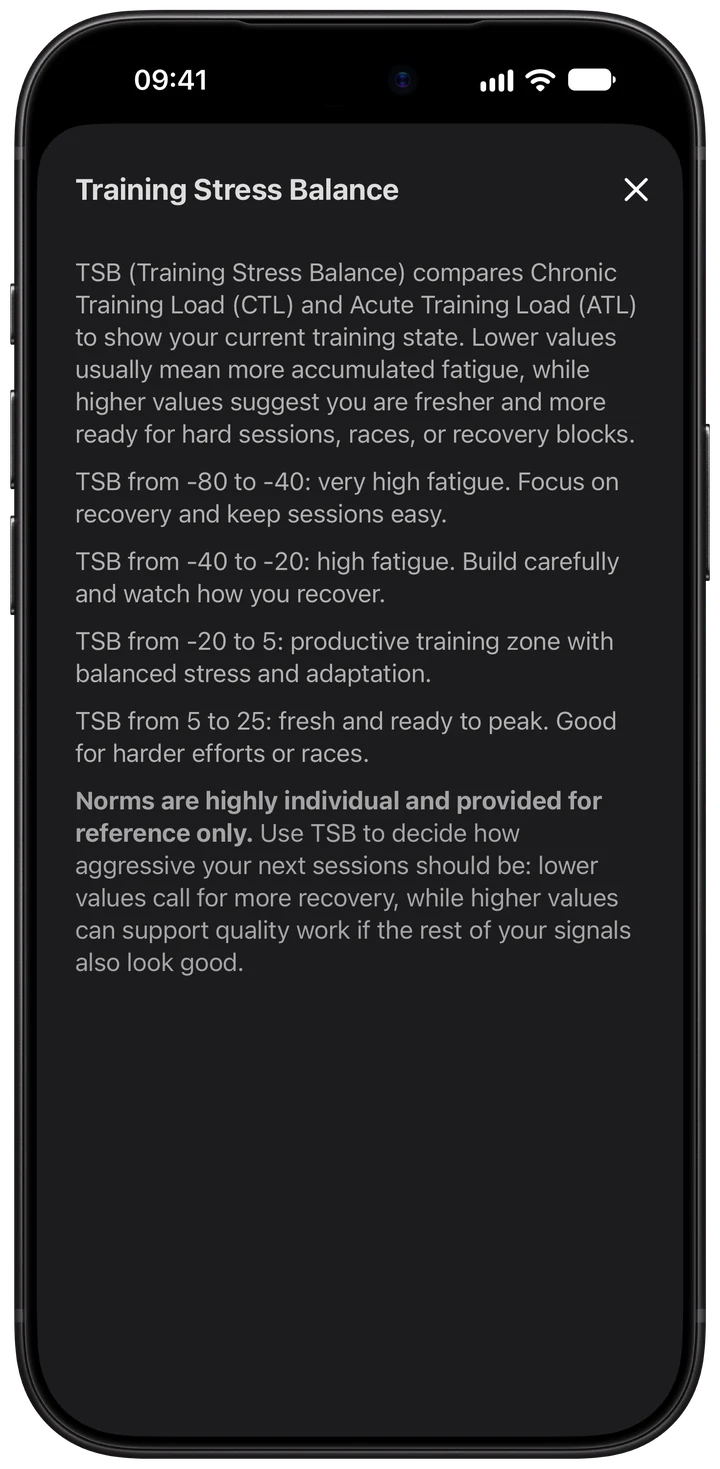
Read the range shown in your own report
The TSB help screen explains the training-state bands and their boundaries. The ranges shown here belong to the demonstration report; use the values and explanation displayed in your own app.
The app's range interpretation takes training background into account. Thin or missing training history can limit that context, even when a current workout has a detailed pulse recording.
For the relationship between resting pulse and load, read how Wellhero tracks resting heart rate.
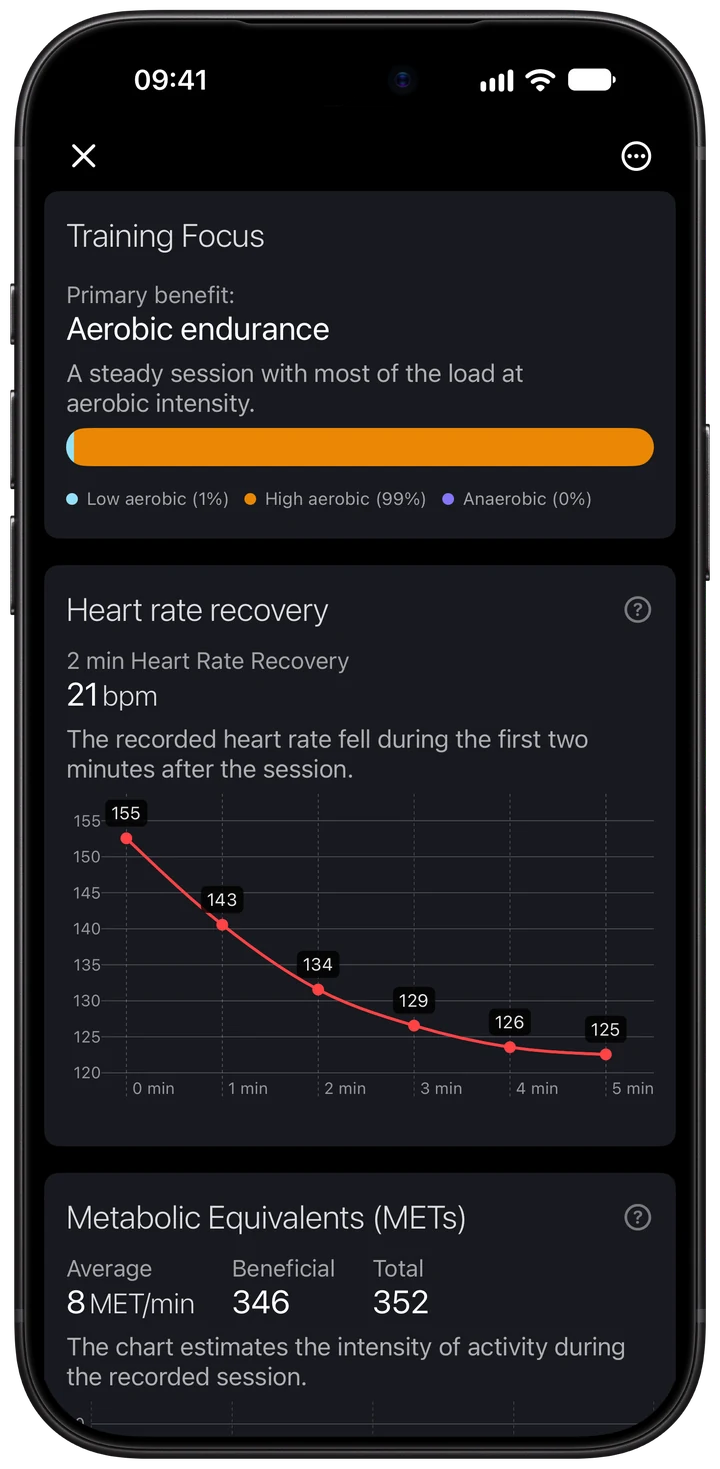
Training Focus: the distribution of load
Training Focus divides TRIMP into Low Aerobic, High Aerobic and Anaerobic components. The chart shows how much load accumulated in each category.
These shares describe accumulated load. The heart rate zone chart describes time. A short, intense part of a workout can contribute a larger share of load than its share of the session's duration.
The categories use estimated intensity boundaries derived from heart rate zones. Read them as an interpretation of the recorded session and compare them with the pulse trace and your intended workout.
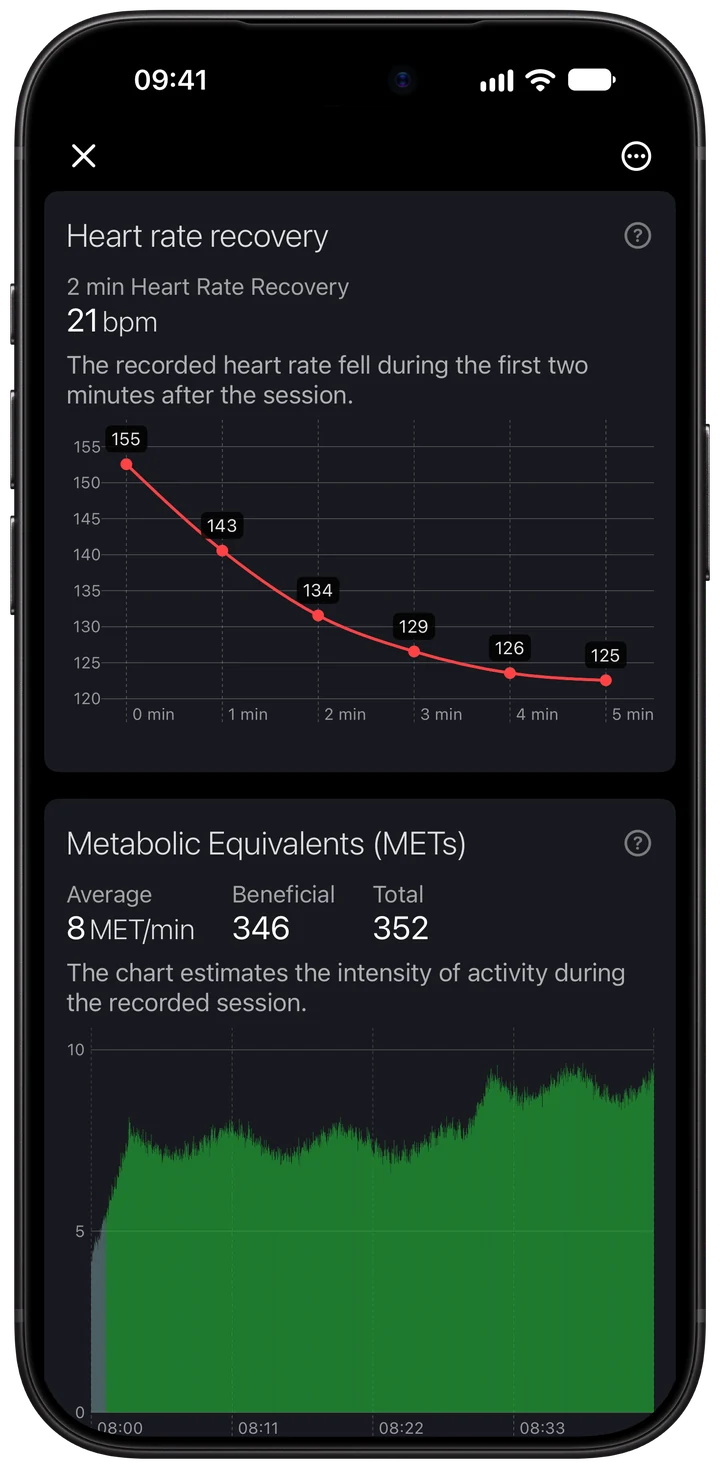
Heart Rate Recovery: what happened after the finish
When suitable post-workout readings are available, Wellhero shows the recorded pulse across the following minutes and the available recovery measurements.
The two-minute reading is the drop from the pulse at the end of the workout. In this example, pulse falls from 155 to 134 bpm, so the report shows a recovery of 21 bpm. Read the starting pulse and elapsed time alongside the drop.
A long cool-down before stopping the workout can change the starting point. Walking, continuing to exercise and differences in recording coverage also affect the comparison between sessions.
Check the graph and session ending before interpreting the drop. If post-workout samples are missing, this section may be absent. Compare similar finishes and recording conditions over time.
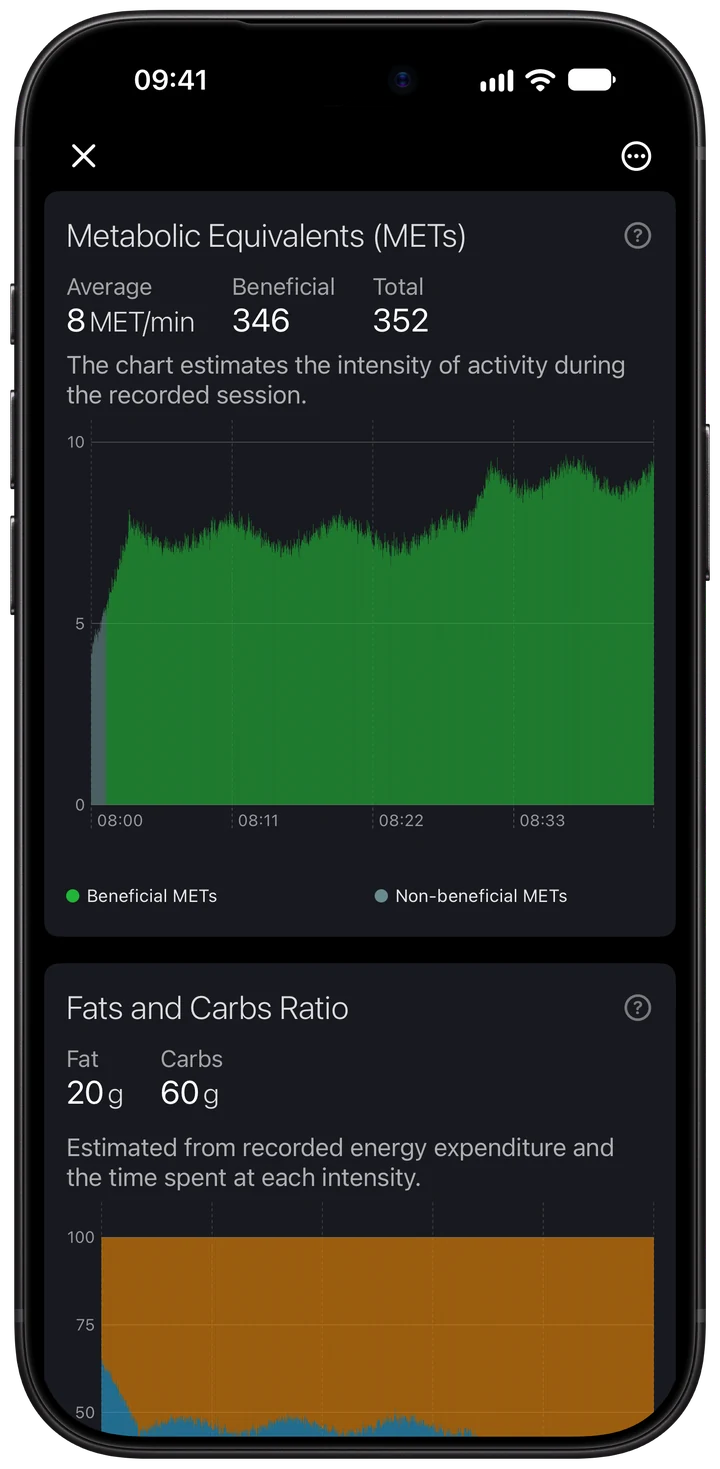
METs: an estimate of activity intensity
A metabolic equivalent, or MET, expresses activity intensity relative to resting energy use. The report plots the available estimates over the session and shows average, beneficial and total summaries.
Average summarizes estimated intensity. Total accumulates intensity over time in MET-minutes: for example, 10 minutes at 6 MET contributes 60 MET-minutes. Beneficial counts the portion accumulated at heart rate Zone 2 or above, which is highlighted in the chart.
Read the timeline to see how intensity varied. Compare the totals alongside duration: a longer session can accumulate more MET-minutes without having a higher average intensity.
These are estimates based on the data available for the workout. Recording gaps and changes in your heart rate settings can affect the analysis.
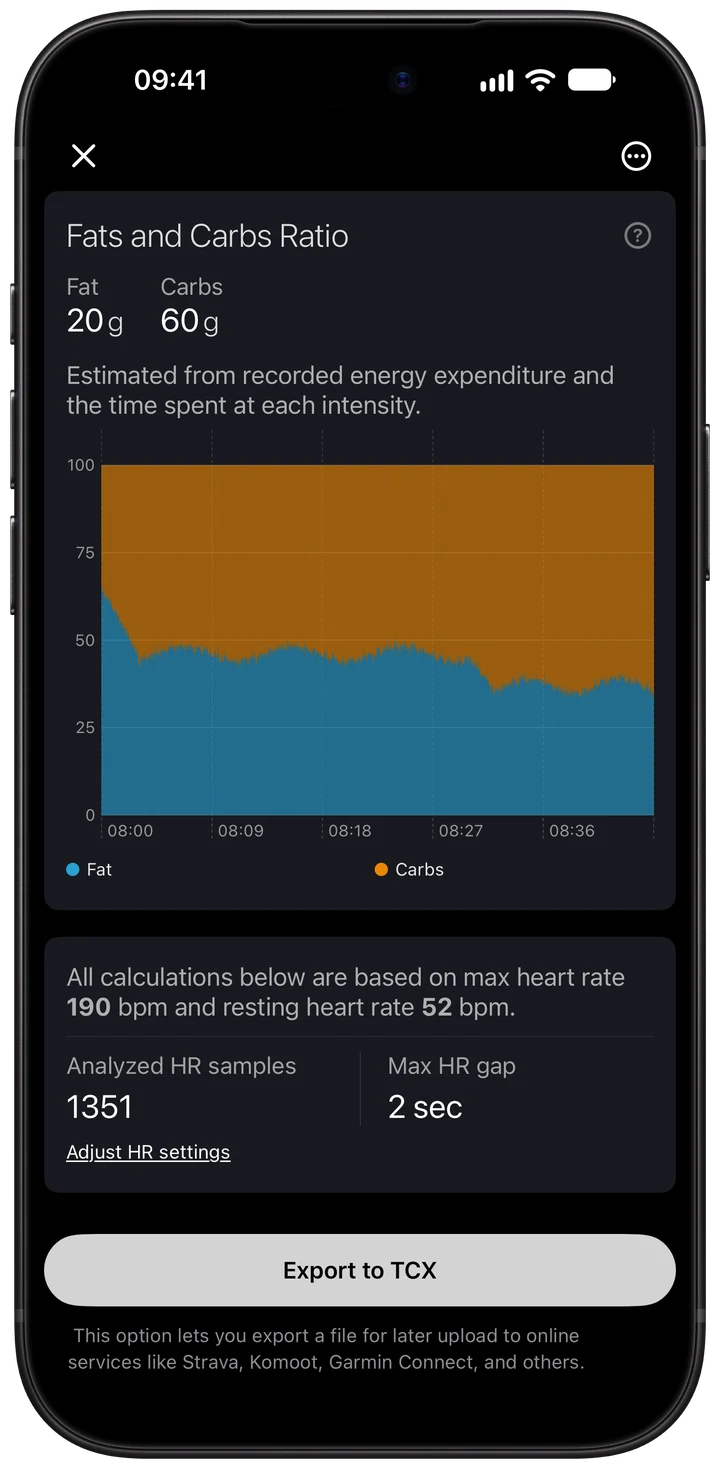
Fats and Carbs Ratio: estimated fuel use
This section shows an estimated fat-to-carbohydrate ratio over the workout and the available totals in grams. Wellhero derives the estimate from recorded energy expenditure and intensity.
Use it to understand how the app interprets the session's energy demand. Differences in intensity can change the estimated fuel mix even when two workouts have similar calorie totals.
The gram totals are modeled estimates. Their precision depends on the calorie and heart rate data supplied for the session.
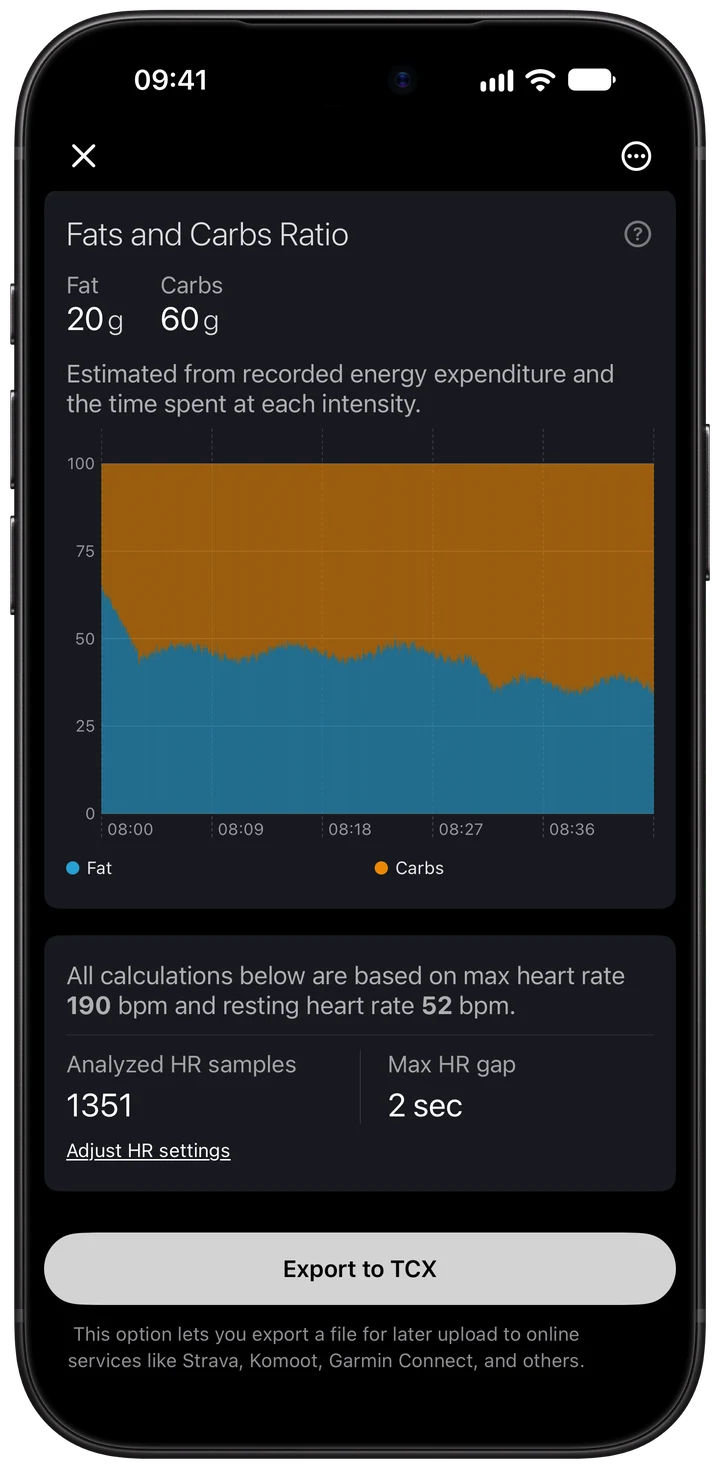
Recording quality, heart rate settings and TCX export
Analyzed HR Samples is the number of heart rate readings used for the workout. Max HR Gap is the longest gap between those readings, shown in seconds. Read both fields alongside the pulse chart.
The report also shows the maximum and resting heart rate values used for calculations. Open Heart Rate Settings from this section to inspect your limits.
With PRO, tap Export to TCX to create a workout file and open the iOS share sheet. You can then save the file or upload it to a service that accepts TCX. The export includes the workout information and locally available samples; file acceptance depends on the receiving service.
Questions about workout analysis
Do I need Wellhero PRO?
The screenshots show PRO report sections unlocked. Training Load, TSB, Training Focus, Heart Rate Recovery, METs, fuel estimates and TCX export require PRO. AI analysis and access to older saved days have their own availability rules, shown in the app. Check current pricing and usage limits there.
Why is my workout or heart rate chart missing?
Check that the workout and its pulse readings are present in Apple Health and that Wellhero has the relevant permissions. In Profile, open Apple Health Data, then Health Status and Workouts to inspect synchronization. A workout record can arrive before its heart rate samples; the report shows a warning when pulse data is still missing.
Does this replace the daily Strain and Recovery overview?
The workout report describes one session. Daily Strain summarizes activity across the day, while Recovery uses the measurements behind your recovery assessment. Read the three together to understand the session in its daily context.
Why can similar workouts show different numbers?
Duration, pulse intensity, recording coverage, heart rate settings and training history all influence the available results. Start with the trace and diagnostics, then compare the load and its effect on your recent history.
How do I use the report alongside sleep?
Review the workout's load, then inspect your sleep report and recovery readings for the surrounding days. Changes across several comparable sessions provide more context than one isolated score.
Open the report behind your next workout
Connect Apple Health, record a session and open it in Wellhero. Start with Strain and the pulse trace, then explore the training load and recording details.
Get Wellhero on the App StoreRead the workout analytics overview, explore recovery tracking or return to all Wellhero features.