
AMo50 Explained: What High and Low Values Mean
By Wellhero · Published
AMo50 is the percentage of heartbeat intervals that fall into the most populated 50-millisecond range. A higher value means more of those intervals have similar lengths. A lower value means fewer are concentrated in a single range.
If your report shows AMo50 of 40%, that percentage describes the distribution of your heartbeat intervals. It does not mean you are 40% stressed.
How AMo50 is calculated
The name stands for amplitude of mode, using 50 ms bins. A bin is a range of interval lengths. For example, one bin might hold intervals from 800 ms up to, but not including, 850 ms. Each accepted interval goes into one bin.
Find the bin with the most intervals, divide its count by the total number of accepted intervals, and multiply by 100. In Wellhero, that gives the AMo50 percentage.
AMo50 = intervals in the busiest bin ÷ total intervals × 100
Imagine a recording with 100 usable intervals. The busiest bin contains 40 of them. Its AMo50 is 40 ÷ 100 × 100 = 40%.
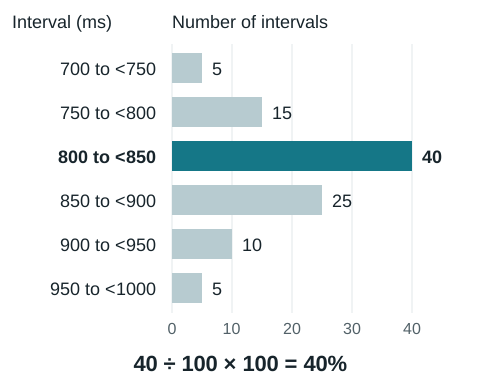
The 50 in AMo50 is the bin width. It does not mean 50 heartbeats or a 50-second measurement. The Kubios description of HRV analysis methods also defines mode amplitude using a histogram with 50 ms bins.
What high and low AMo50 values mean
Higher AMo50
At 70%, seven out of every ten accepted intervals fit into the same 50 ms bin. That is a strong concentration around one interval length. This concentration is one of the inputs used in the Baevsky Stress Index, so AMo50 can help explain a higher index.
The percentage alone cannot tell you why the pattern occurred or how stressed you feel. It also leaves out how widely the remaining intervals are spread.
Lower AMo50
At 20%, the busiest bin contains one fifth of the intervals. The recording is less concentrated in any single bin. However, this does not establish good recovery or make the reading automatically better than a higher value.
Check measurement quality before interpreting an unusual result. Errors in detected beats can change the interval distribution. Breathing and recording conditions also affect HRV, as discussed in Laborde and colleagues' recommendations for HRV measurement.
What is a normal AMo50?
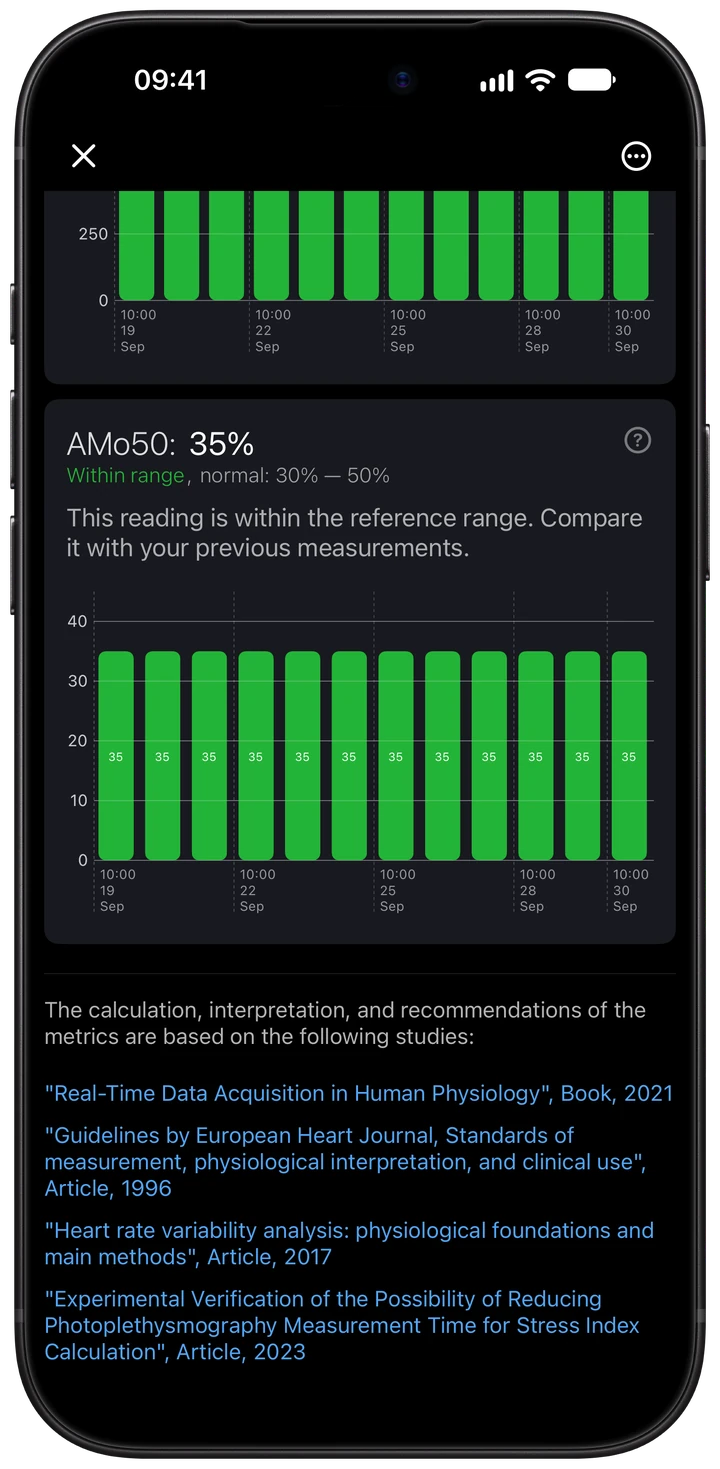
Wellhero currently marks 30% to 50% as its central reference band. In this example, 35% falls inside that band and the card labels it Within range.
This is the app's interpretation range. It is not a universal clinical cutoff, and crossing its boundary does not diagnose a health problem. A value within the band also cannot confirm that you are fully recovered.
Open a measurement report and scroll to the AMo50 card to see the value beside your recent readings. Compare measurements taken in similar circumstances, and look at the report's other metrics when something changes.
Wellhero can analyze intervals from supported Apple Watch sessions or an iPhone camera measurement. AMo50 requires the interval data; a standalone SDNN value is not enough to calculate it.
AMo50 and pNN50 measure different things
Both appear as percentages and both contain 50 in their names. Their calculations answer different questions.
| Metric | What is counted |
|---|---|
| AMo50 | Intervals in the most populated 50 ms bin, as a percentage of all accepted intervals |
| pNN50 | Consecutive interval pairs that differ by more than 50 ms, as a percentage of all consecutive pairs |
Order matters for pNN50. As a tiny mathematical example, take four intervals: 800, 800, 900 and 900 ms. Only one of the three consecutive pairs differs by more than 50 ms. Rearrange them as 800, 900, 800 and 900 ms, and all three pairs do.
AMo50 stays at 50% in both arrangements because the bin counts have not changed. That is why AMo50 alone cannot describe beat-to-beat variation. See our guide to HRV metrics for SDNN, RMSSD and the other values in a report.
How AMo50 contributes to Baevsky Stress Index
Wellhero's Baevsky Stress Index calculation uses AMo50 together with the most frequent interval length (Mo) and the difference between the longest and shortest intervals (MxDMn).
BSI = AMo50 ÷ (2 × Mo × MxDMn)
For a complete calculation with units and a worked example, read Baevsky Stress Index: formula and interpretation.
In this formula, AMo50 is entered as a percentage, while Mo and MxDMn are in seconds. If both denominator values stay the same, doubling AMo50 doubles BSI. In a real recording, all of these inputs can change.
AMo50 is therefore only part of the calculation. Read how Wellhero interprets Baevsky Stress Index for the distinction between the index and the stress percentage shown in the app.
Take care with comparisons across apps. Bin boundaries and interval processing can affect results. For example, Kubios describes preprocessing and a square-root transformation of its stress index; its displayed number should not be assumed to match an untransformed BSI.
How to compare your AMo50 readings
Use the same measurement method and a similar recording duration. Sit in the same position, allow yourself to settle, and keep still during the recording. For a resting comparison, breathe normally; a deliberate breathing exercise creates a different measurement context.
If a result looks unusual, check the signal quality and compare it with other readings taken under similar conditions. A single percentage gives you limited information. The history is more useful when you know what you were doing during each measurement.
Start with our Apple Watch HRV guide or the camera measurement instructions. Wellhero is a wellness tool; its AMo50 interpretation is not a medical diagnosis.
Download Wellhero on the App StoreSources and calculation notes
- Kubios: HRV analysis methods. Definitions of histogram-based mode amplitude, pNN50 and the stress index used in Kubios.
- Laborde, Mosley and Thayer (2017): Recommendations for HRV measurement and analysis. Recording conditions, breathing and handling artifacts.
The Wellhero calculation and reference band described here were checked against the app's implementation for this article. The histogram is a worked example; the app screenshot uses separate demonstration data.