
Baevsky Stress Index Explained: Formula and Interpretation
By Wellhero · Published
Baevsky Stress Index, or BSI, is an HRV calculation based on the distribution of heartbeat intervals. It combines how tightly the intervals cluster, their most common length, and the distance between the shortest and longest intervals.
A higher result can indicate greater physiological strain. Interpreting it takes some context: the recording method, your posture, and the scale used by the app all matter. BSI cannot tell you what caused a change or how anxious you feel.
The Baevsky Stress Index formula
For a histogram with 50 ms bins, the calculation used in Wellhero is:
BSI = AMo50 ÷ (2 × Mo × MxDMn)
| Input | Meaning | Value to enter |
|---|---|---|
| AMo50 | The percentage of accepted intervals in the most populated 50 ms bin | 40 for 40% |
| Mo | The most frequent interval length | Seconds: 800 ms = 0.80 s |
| MxDMn | The longest accepted interval minus the shortest | Seconds: 250 ms = 0.25 s |
You may see the numerator written as AMo in research. The notation can mean a percentage or a fraction that is multiplied by 100. In the formula above, enter the percentage number directly. Multiplying 40 by 100 again would inflate the answer a hundredfold.
Mo and MxDMn must use seconds for this scale. Leaving both in milliseconds makes the numerical answer a million times smaller. BSI is conventionally reported as an index value or in conventional units, so a result of 100 should not be labelled 100 ms.
Lee and colleagues' 2023 paper describes the formula, the 50 ms histogram, and the interval units. Wellhero calculates Mo from the most frequent whole-millisecond interval. Other implementations may estimate Mo differently.
A worked example: BSI of 100
Suppose a recording has AMo50 of 40%, Mo of 800 ms, and a range from 650 to 900 ms. The range is 250 ms. Convert the two time values to seconds, then substitute them:
40 ÷ (2 × 0.80 × 0.25) = 40 ÷ 0.40 = 100
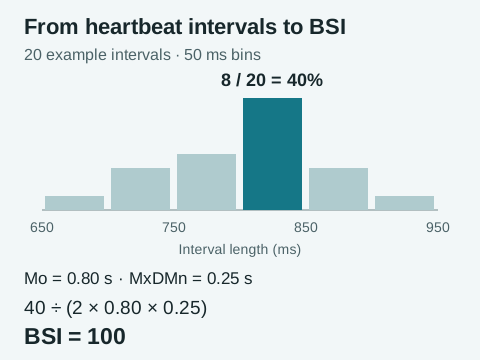
Keeping AMo50 and Mo fixed, doubling MxDMn to 500 ms would lower BSI to 50. Keeping Mo and MxDMn fixed, increasing AMo50 from 40% to 60% would raise BSI to 150. These are changes to one input at a time; real recordings can change all of them.
What high and low BSI mean
The formula gives a higher number when intervals cluster more tightly, when the most common interval becomes shorter, or when the overall range narrows, with the other inputs held constant. Researchers use this pattern to study sympathetic activity and the body's response to a task or change in posture.
A lower BSI can occur when intervals have a wider range and a less concentrated distribution. Its meaning still depends on the recording. One missed or extra detected beat can stretch MxDMn and pull BSI down. A low number by itself does not establish good recovery.
The word “stress” covers several different experiences. A study of BSI from finger pulse recordings included rest and measurements after push-ups. Its protocol illustrates why a physiological stress index can change after physical effort, even when you do not feel worried. See the study's measurement protocol.
BSI does not measure cortisol and cannot diagnose an anxiety disorder. If your question is about hormones, our guide to Apple Watch and cortisol measurement explains the distinction.
What is a normal Baevsky Stress Index?
Wellhero marks 50 to 150 as its central reference band for the original BSI scale. Treat this as an interpretation aid for the app's measurement, with your recording conditions and usual results in mind.
The familiar 50 to 150 range is not a universal clinical boundary. In a 2025 study of 73 self-declared healthy participants, baseline BSI and its response to standing varied with age. The authors found the traditional range consistent with their youngest group and argued for age-specific reference ranges.
A result above the band does not identify the cause, and a result below it is not automatically a problem. For comparisons over time, use recordings taken under similar conditions. The announcement about Wellhero's revised stress ranges explains the app's category changes and how they affected its stress percentage.
Why two apps can show different stress indices
Check the scale before comparing values. Kubios documents a square-root transformation of Baevsky's index. An original BSI of 100 becomes 10 after taking its square root. Those numbers express the same mathematical example on different scales.
The transformation is only one difference. Kubios also describes removing slow trends from the interval series and using the median interval for Mo. Wellhero uses the most frequent whole-millisecond interval. Filtering, histogram construction and the selected recording segment can change the inputs before either app applies the formula.
Squaring a displayed Kubios value reverses the square-root step. It does not undo differences in preprocessing or make the result directly interchangeable with a Wellhero measurement.
Reading BSI in Wellhero
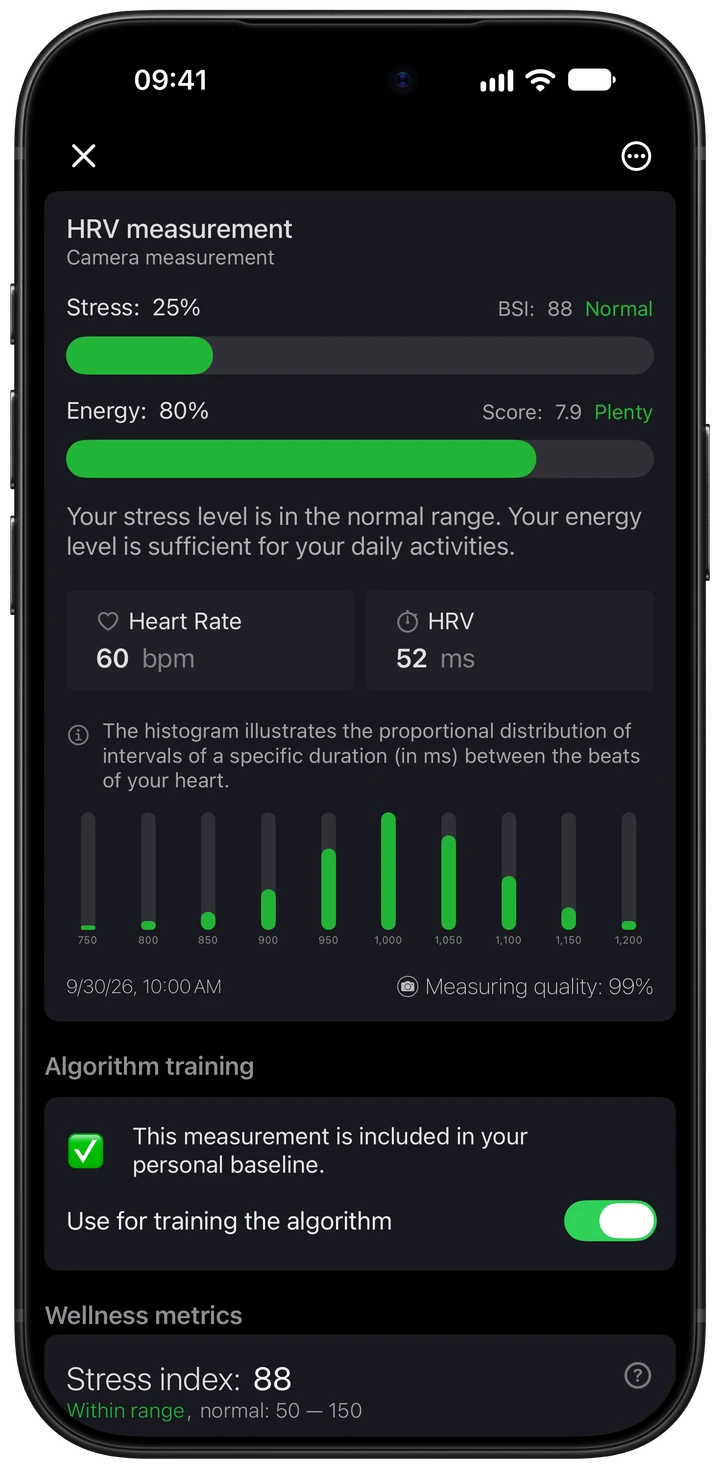
The measurement report shows the original Stress Index alongside a stress percentage. In this demonstration report, BSI is 88 and stress is 25%. The percentage is the app's interpretation of stress on its own scale; it is not the BSI number with a percent sign added.
The histogram helps you see how the intervals are distributed. Open the AMo50 explanation for the most populated bin or the MxDMn explanation for the range between the extremes.
For the wider measurement workflow, see stress monitoring with Wellhero.
How to compare your measurements
Use the same measurement method and a similar recording duration. For a resting comparison, settle into the same posture each time and breathe normally. Keep a deliberate breathing session separate from your ordinary resting readings.
Check signal quality before interpreting an unusual result. Movement and misdetected beats can affect the interval distribution. Measurement guidance from Laborde, Mosley and Thayer explains why posture, breathing and artifact handling need consistent treatment.
A BSI value describes one recording. Look at repeated comparable measurements, the rest of your HRV report, and how you feel before drawing conclusions from a change.
To take a reading, follow our iPhone camera measurement guide or learn about Apple Watch HRV measurements.
Download Wellhero on the App StoreCommon questions
Can I calculate BSI from an SDNN or RMSSD value?
No. Neither number supplies the histogram percentage, mode and full interval range needed by the BSI formula. You need the underlying accepted intervals or the required inputs calculated from them. The HRV metrics guide explains what the different measures describe.
Does a BSI of 100 mean I am 100% stressed?
No. The worked example produces an index value of 100, which is inside Wellhero's central BSI reference band. A stress percentage uses a separate scale.
Sources and calculation notes
- Lee, Song and Lee (2023): Stress Index calculation from pulse recordings. Formula, histogram width and measurement protocol.
- Huizinga and colleagues (2025): Determining autonomic sympathetic tone and reactivity using Baevsky's stress index. Calculation choices, age and postural response.
- Kubios: HRV analysis methods. Preprocessing, Mo estimation and the square-root scale.
- Laborde, Mosley and Thayer (2017): HRV measurement and analysis recommendations. Recording conditions and artifacts.
The formula example uses illustrative inputs. The app screenshot contains demonstration data and is a separate measurement from the example.